Food Waste
Food Waste Statistics 2025
The UK wastes 10.2 million tonnes of food per year. Discover the latest food waste statistics covering global food waste data, prevention stats, and more.
With global food systems under mounting pressure, the scale of food waste is becoming one of the defining issues of our time. The UK is no exception, with the latest figures estimating total annual wasted food at 10.2 million tonnes, with six million coming from households.1
Despite the growing focus on food waste reduction, there are still many changes required if we’re to successfully tackle the environmental crisis and build towards a net-zero future.
We’ve compiled a food waste statistics report examining the scale of this problem. Tackling the issue of food waste is something we can’t ignore.
We’ll cover everything from global production to the most common types of food waste while highlighting the preventative measures being taken to help reverse the trend.
10 must-know food waste facts and stats
The UK wastes 10.2 million tonnes of food per year.1
Six million tonnes of food waste comes from households alone – 58% of the overall total.1
The term ‘Food Waste Recycling’ saw its search volumes rise 28% between September 2024 and 2025 in the UK, suggesting increasing public interest.
UK search interest in the term ‘Food Waste Management’ more than tripled between September 2024 and 2025.
73% of food thrown away by UK households is food that could’ve been eaten.1
Around 18 million tonnes of CO2 are generated from UK food and drink waste each year.2
China has the highest volume of food waste globally, at nearly 109 million tonnes per year.3
The annual cost of edible household food waste in the UK is over £17 billion.1
Britain’s top 10 biggest supermarkets were found to donate less than 9% of their consumable food waste.4
Potatoes are the most wasted food in the UK, with an average daily wastage of 1,300 tonnes.4
Global food waste statistics
How much food waste is produced each year?
Over a third of all food produced globally is wasted. This figure is considered a conservative estimate, with more recent data suggesting that the percentage of lost or wasted food could be as high as 40%.5,6
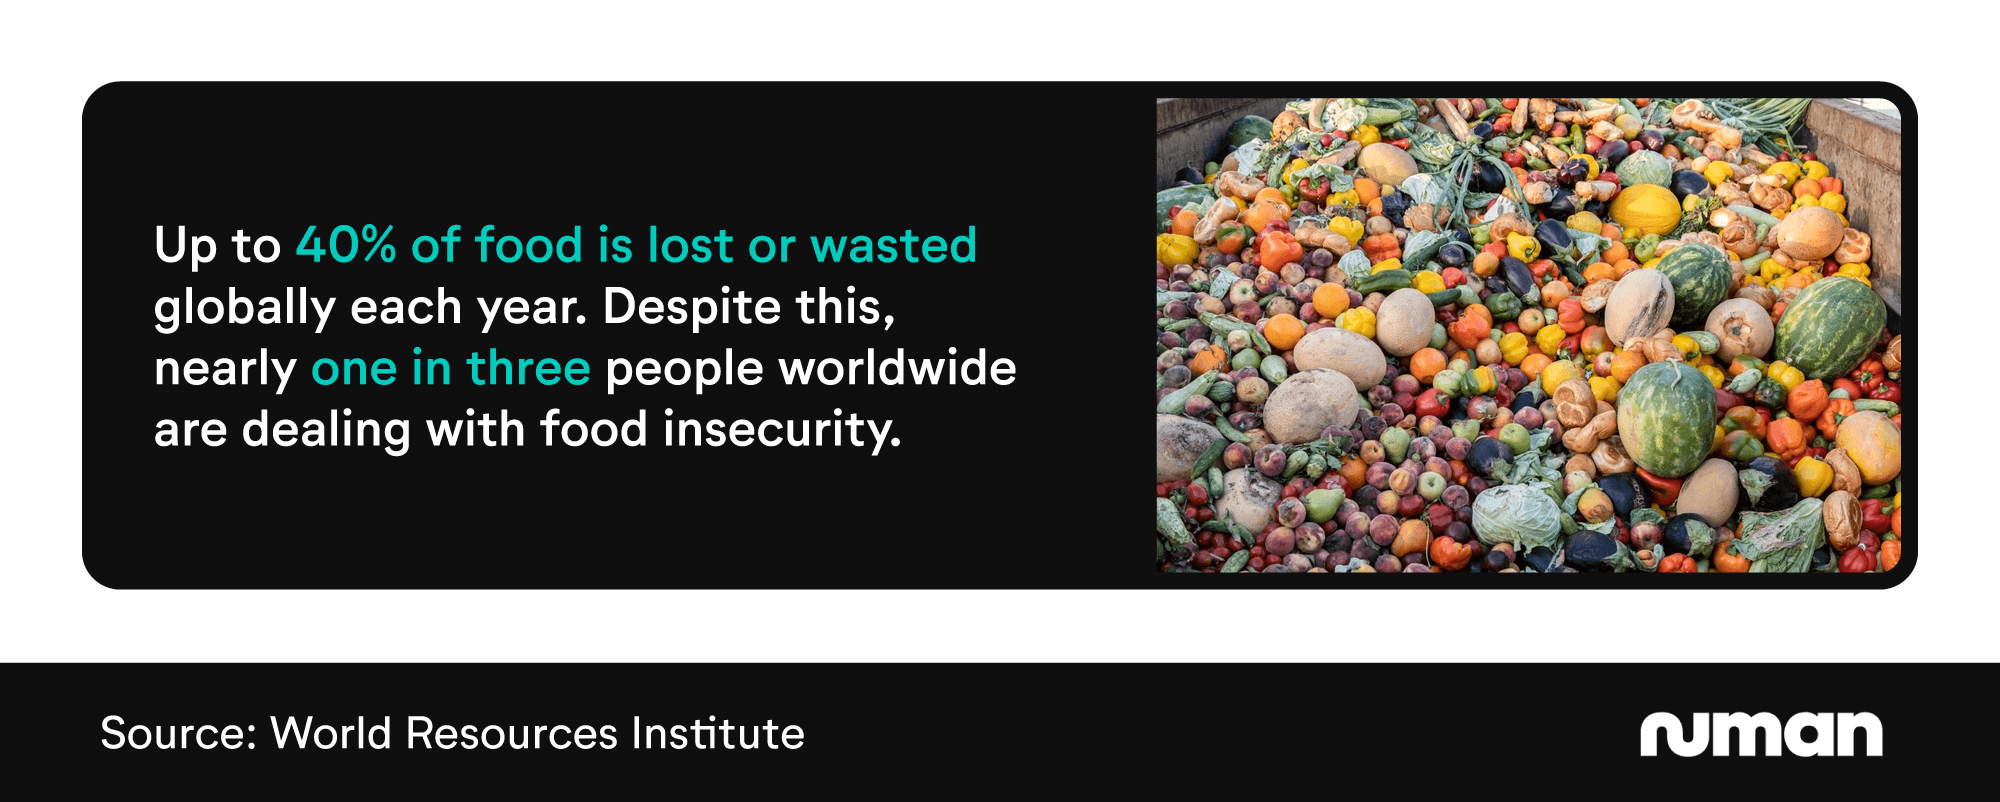
This means that the amount of wasted food we produce would be big enough to fill an area of land larger than China.5 Elsewhere, a report from the Boston Consulting Group (BCG) claims that 1.6 billion tonnes of food are lost or wasted globally each year – worth roughly $1.2 trillion.7,8
Despite the huge volumes of food waste, nearly one in three people worldwide lives with some level of food insecurity. This highlights a significant lack of resourcefulness among global food systems, a fact that becomes even more concerning when considering that food waste is linked to 8-10% of global greenhouse gas emissions.5
While the United Nations (UN) has set a goal to halve retail and consumer food waste per capita globally by 2030, it’s estimated that just 12% of the population lives in countries that track their food waste.5,9
How much food waste is generated in Europe?
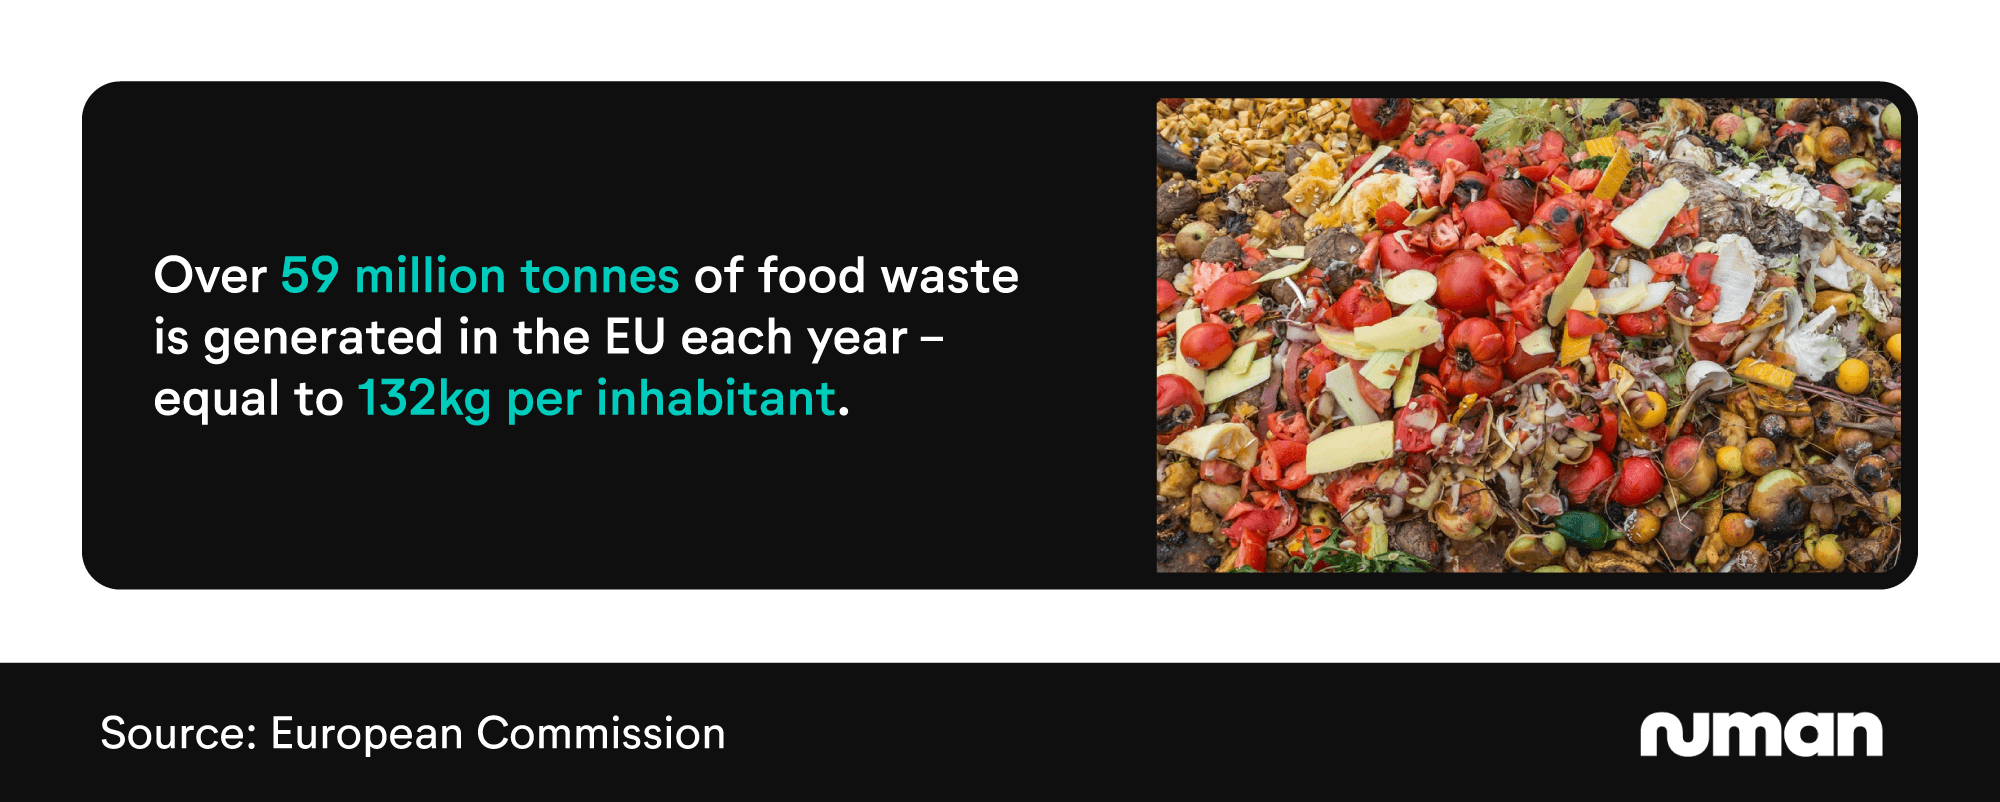
A 2024 report from Eurostat revealed that over 59 million tonnes of food waste per year were generated across EU nations. This is 132kg per person, equating to an estimated value of €132 billion.10
This problem is compounded by the fact that over 42 million people in Europe can’t afford a quality meal every other day.10
UK food waste statistics
How much food do we waste in the UK?
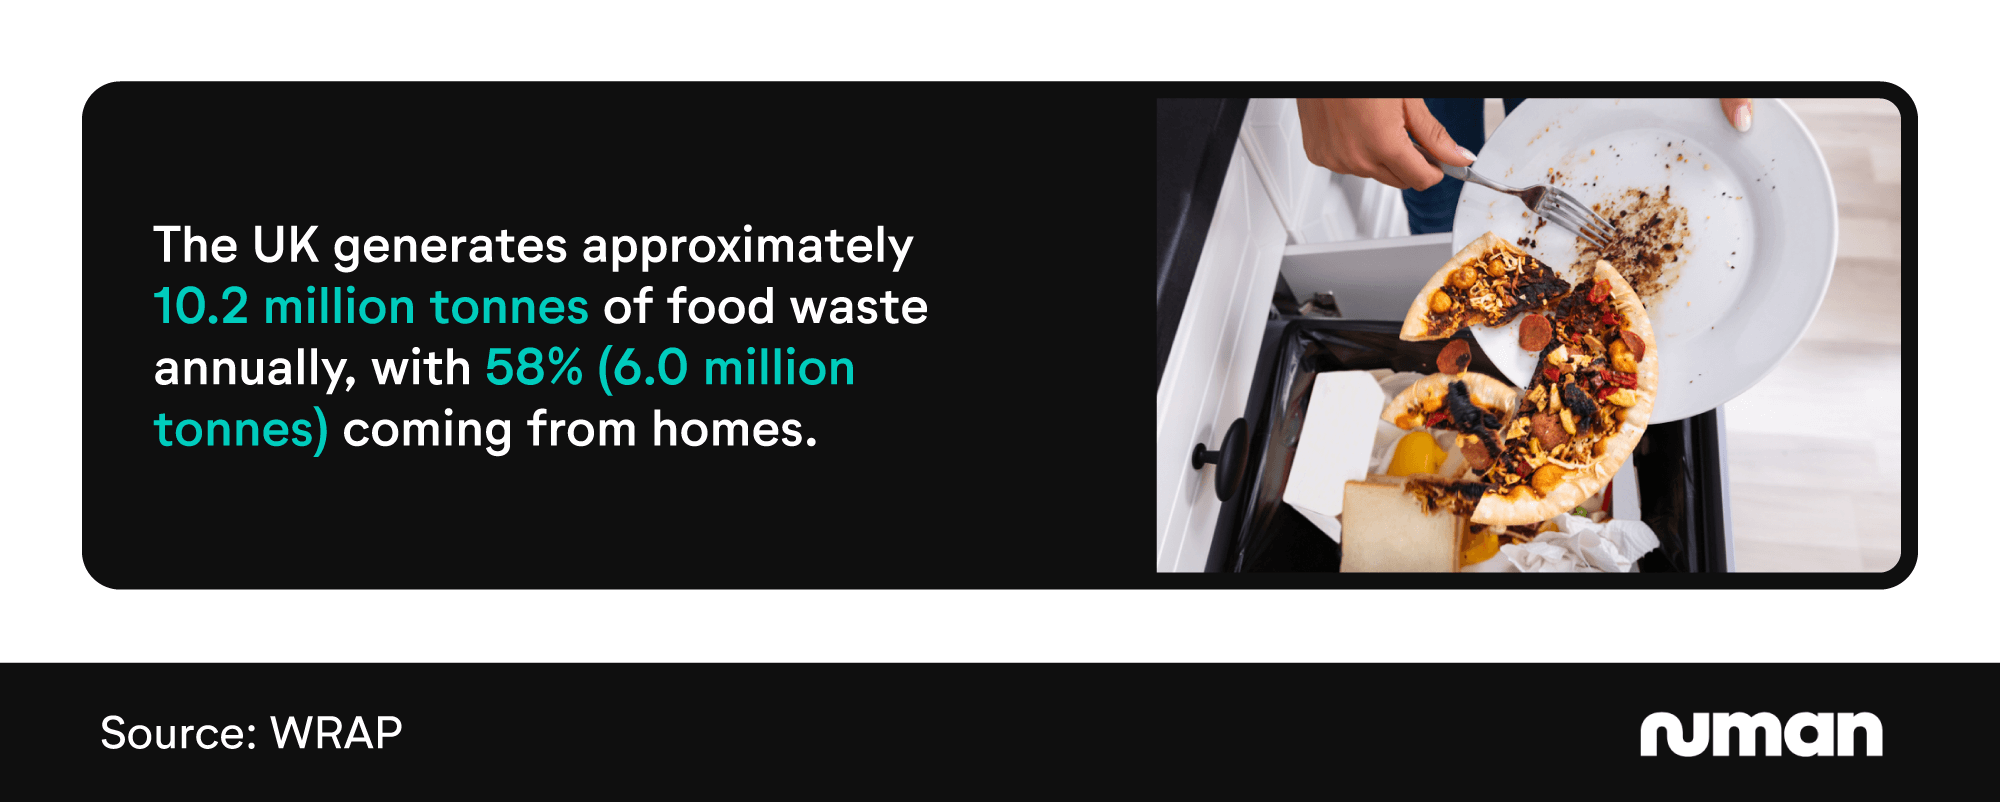
A 2025 report from the Waste and Resources Action Programme (WRAP) estimated that the UK wasted 10.2 million tonnes of food between 2021 and 2022.1 Around 7.5 million UK residents lived in households experiencing food poverty between 2023 and 2024 – around 11% of the population and 18% of children.11
What’s more, an estimated 18 million tonnes of CO2 is generated from UK food and drink waste each year. This highlights the significant economic and environmental benefits the UK could have by improving its food waste management.12
Despite this, there have been encouraging trends in recent years. Data from WRAP showed that UK households threw away around a quarter (24%) less food per capita in 2022 than in 2007.1
How much food waste is generated from UK households?
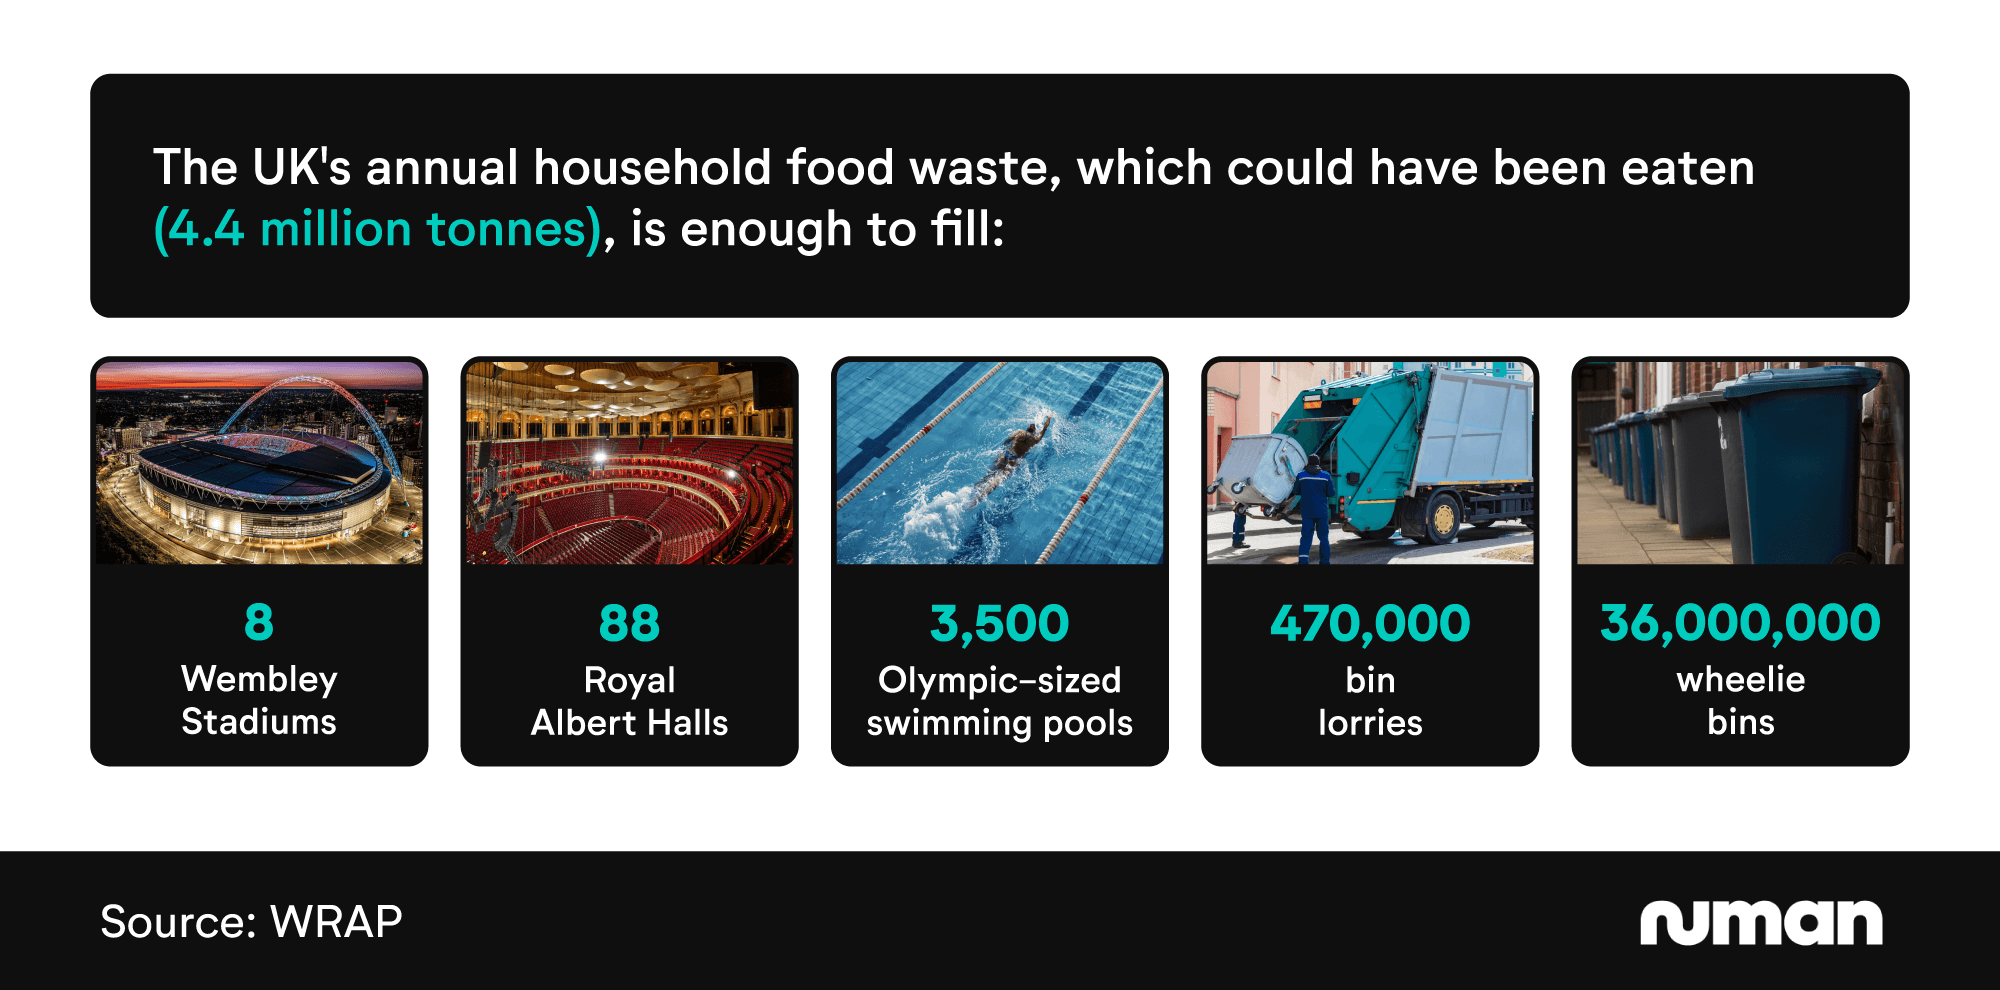
In total, approximately six million tonnes of UK food waste came from households between 2021 and 2022 – around 58% of the overall total.1 Of the food thrown away, around 73% (or 4.4 million tonnes) could’ve been eaten.1
The average UK person wastes food equal to around three meals per week. This equates to a total value of over £17 billion, meaning the average four-person household loses around £1,000 per year from edible food waste.1
Total annual UK household food waste and the percentage that could’ve been eaten
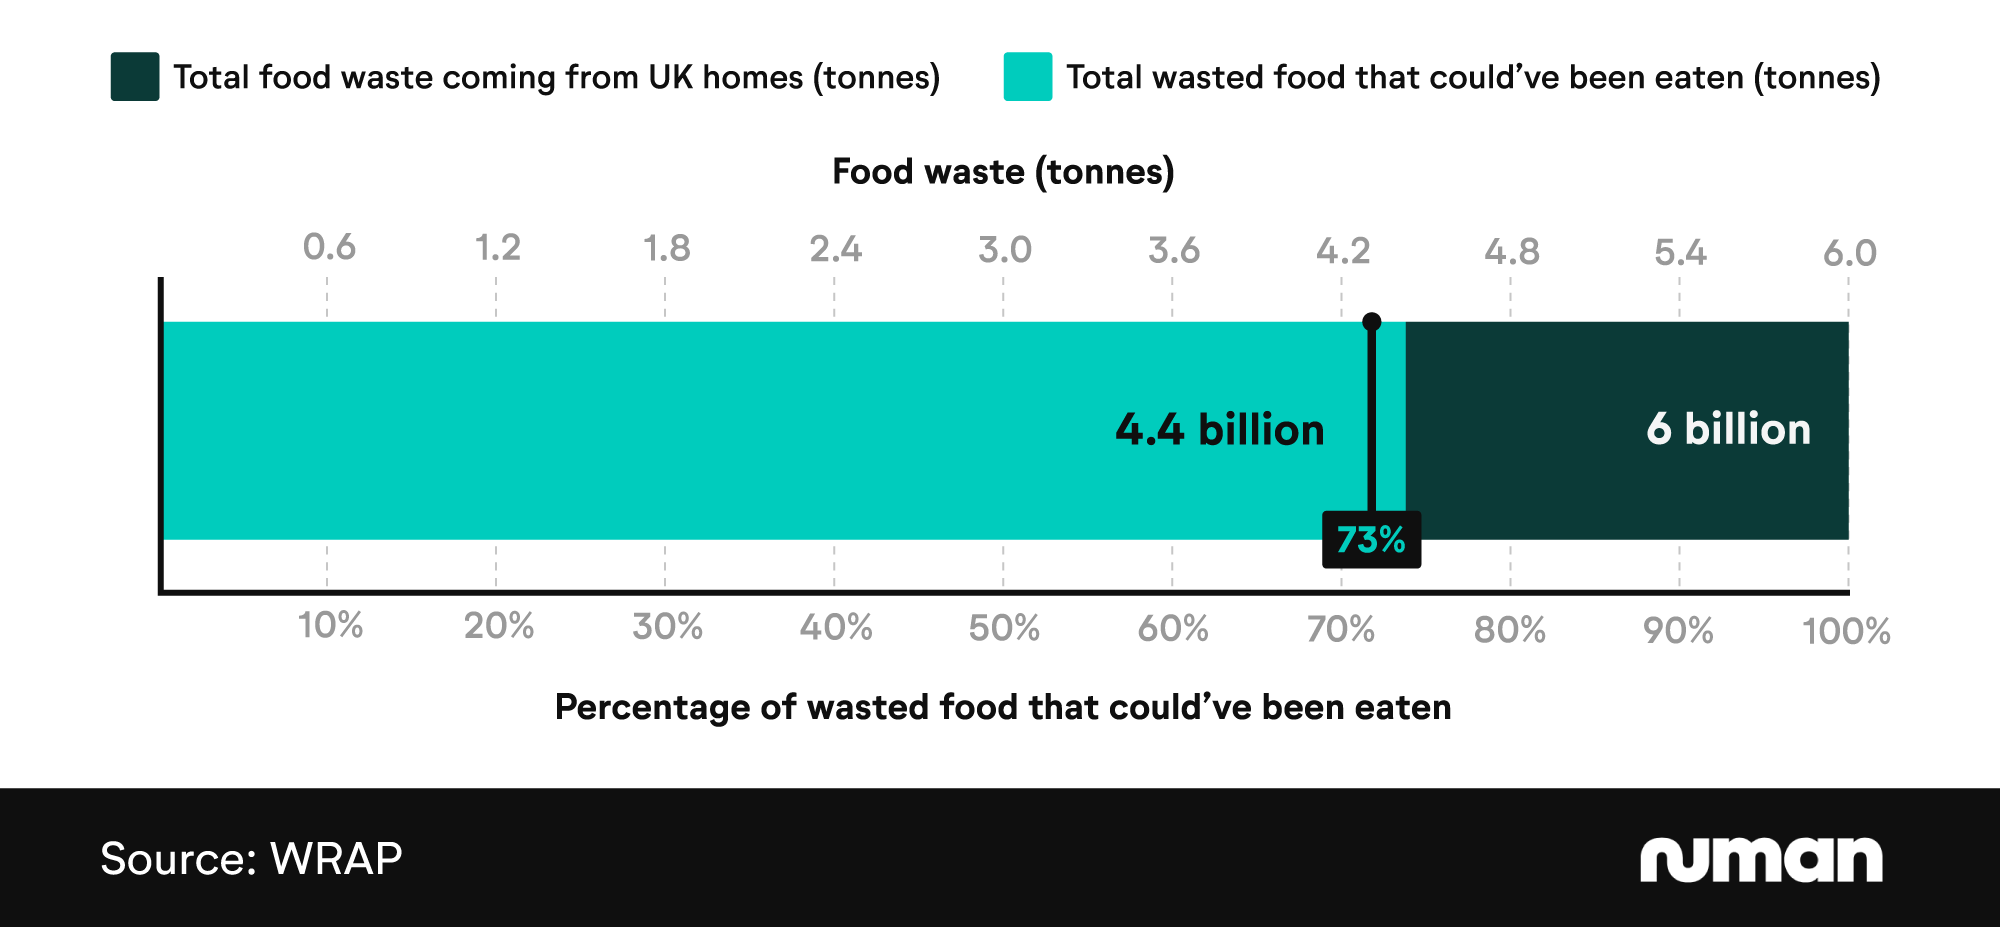
To put this in perspective, the wasted household food that could be eaten would be enough to fill:1
8 Wembley Stadiums
88 Royal Albert Halls
3,500 Olympic-sized swimming pools
470,000 bin lorries
36 million wheelie bins (based on a standard 240 litre bin)
Why do people waste food at home?
WRAP’s food waste statistics show that the main reason households throw away edible food is that too much was cooked or prepared. Nearly 1.1 million tonnes of food waste came from residents cooking, preparing, or serving too much, 25% of the overall total.1
Overall, this food is worth almost £5 billion, highlighting the financial benefits of effective portion control.1 While portion management is more commonly associated with benefits like weight loss and nutritional health, reducing surplus food while preparing meals can result in less waste and a reduction in your supermarket spending.
The most common reasons for throwing away household food in the UK1
| Reasons for throwing away food | Total weight of food thrown away for this reason | Percentage of food thrown away for this reason (by weight) | Total value of food thrown away for this reason |
|---|---|---|---|
| Smelled/looked off | 953,000 | 22% | £3.71 billion |
| Past date on the label | 758,000 | 17% | £3.15 billion |
| Personal preference | 977,000 | 22% | £3.25 billion |
| Cooked, prepared, or served too much | 1.094 million | 25% | £4.95 billion |
| Other | 579,000 | 13% | £2.40 billion |
(Source: WRAP)
Just under a million tonnes (977,000) of food was thrown away out of ‘personal preference’. This suggests that at least £3.25 million worth of food was discarded when it was likely still fine to eat.1
By comparison, 953,000 tonnes of food waste was food that smelled or looked off – 22% of the overall total.
Numan’s State of Obesity report covers all of the facts and misconceptions driving change in the UK.
Food waste by country statistics
Which country has the most food waste?
China has the highest food waste of any country, with nearly 109 million tonnes generated in 2024. This was over 30 million more than any other nation, making China the only one with more than 100 million tonnes of food waste.3
Though second-placed India’s total of just over 78 million tonnes was substantially less than China's, it was more than double the total of any other country. It’s worth noting that China and India are the two countries with the two biggest populations worldwide.3
Top 10 countries with the most food waste worldwide3
Asia dominates the list of countries with high food waste production, with 50% of the top ten and all of the top three based on the continent. Nigeria and the US had the highest food waste counts of any non-Asian nations, with each producing over 24 million tonnes each year.3
Which country produces the least food waste?
With just 598 tonnes of annual food waste, the Oceanic island of Nauru has the lowest food waste of any UN-recognised country.3 This was over 200 tonnes less than any other nation, with fellow Oceania island Tuvalu the only other with less than 1,000 tonnes of food waste.3
Top 10 countries with the least food waste worldwide
Oceania dominates the list of countries with the least food waste, with five of the top ten coming from the continent. Of the remaining, three are based in Europe (San Marino, Monaco, Liechtenstein), with two from the Caribbean region (Saint Kitts-Nevis and Dominica).3
Which country produces the most food waste per capita
The latest food waste statistics show that the Maldives has the highest food waste per capita of any nation.
With 207kg of food wasted for every resident, the Maldives was the only nation with more than 200kg of waste per capita – 24kg more than second-placed Seychelles.3
Top 10 countries with the highest food waste per capita
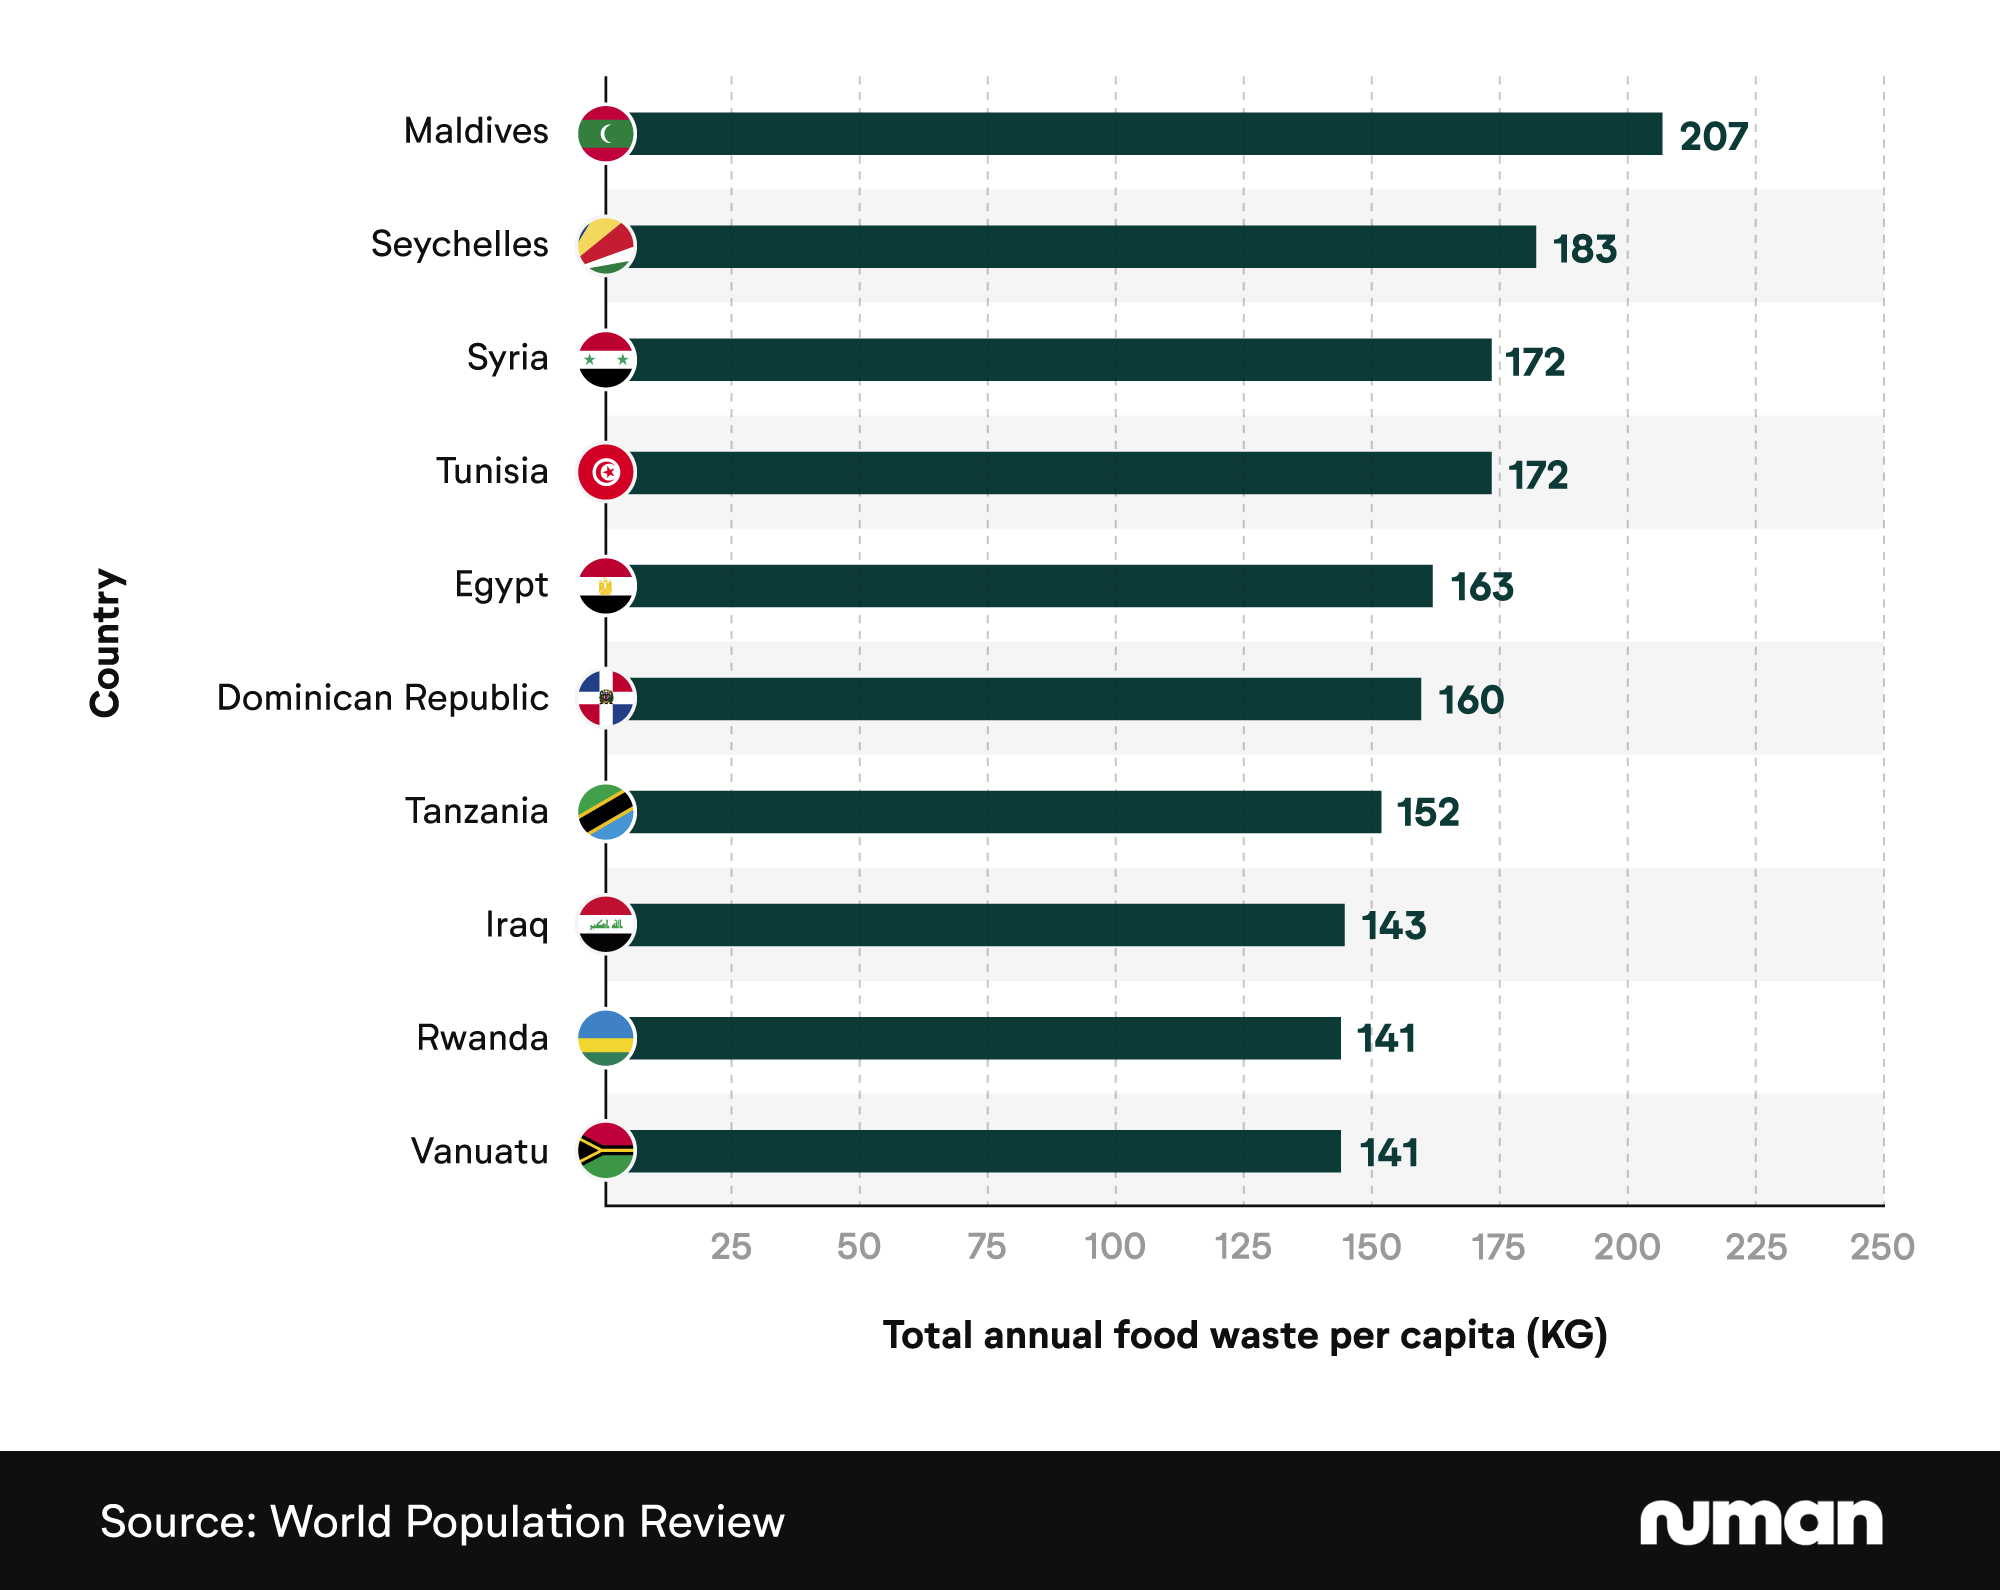
Syria and Tunisia shared third place, with 172kg of food waste per capita, 9kg more than fifth-placed Egypt. Africa is the most represented continent in the top ten with five nations, followed by Asia (three).3
Which country produces the least food waste per capita
With just 18kg of food waste per person per year, Mongolia has the lowest food waste per capita of any country. Mongolia was followed by fellow Asian nation Bhutan (19kg), which was the only other country with a food waste per capita below 20kg.3
Top 10 countries with the lowest food waste per capita
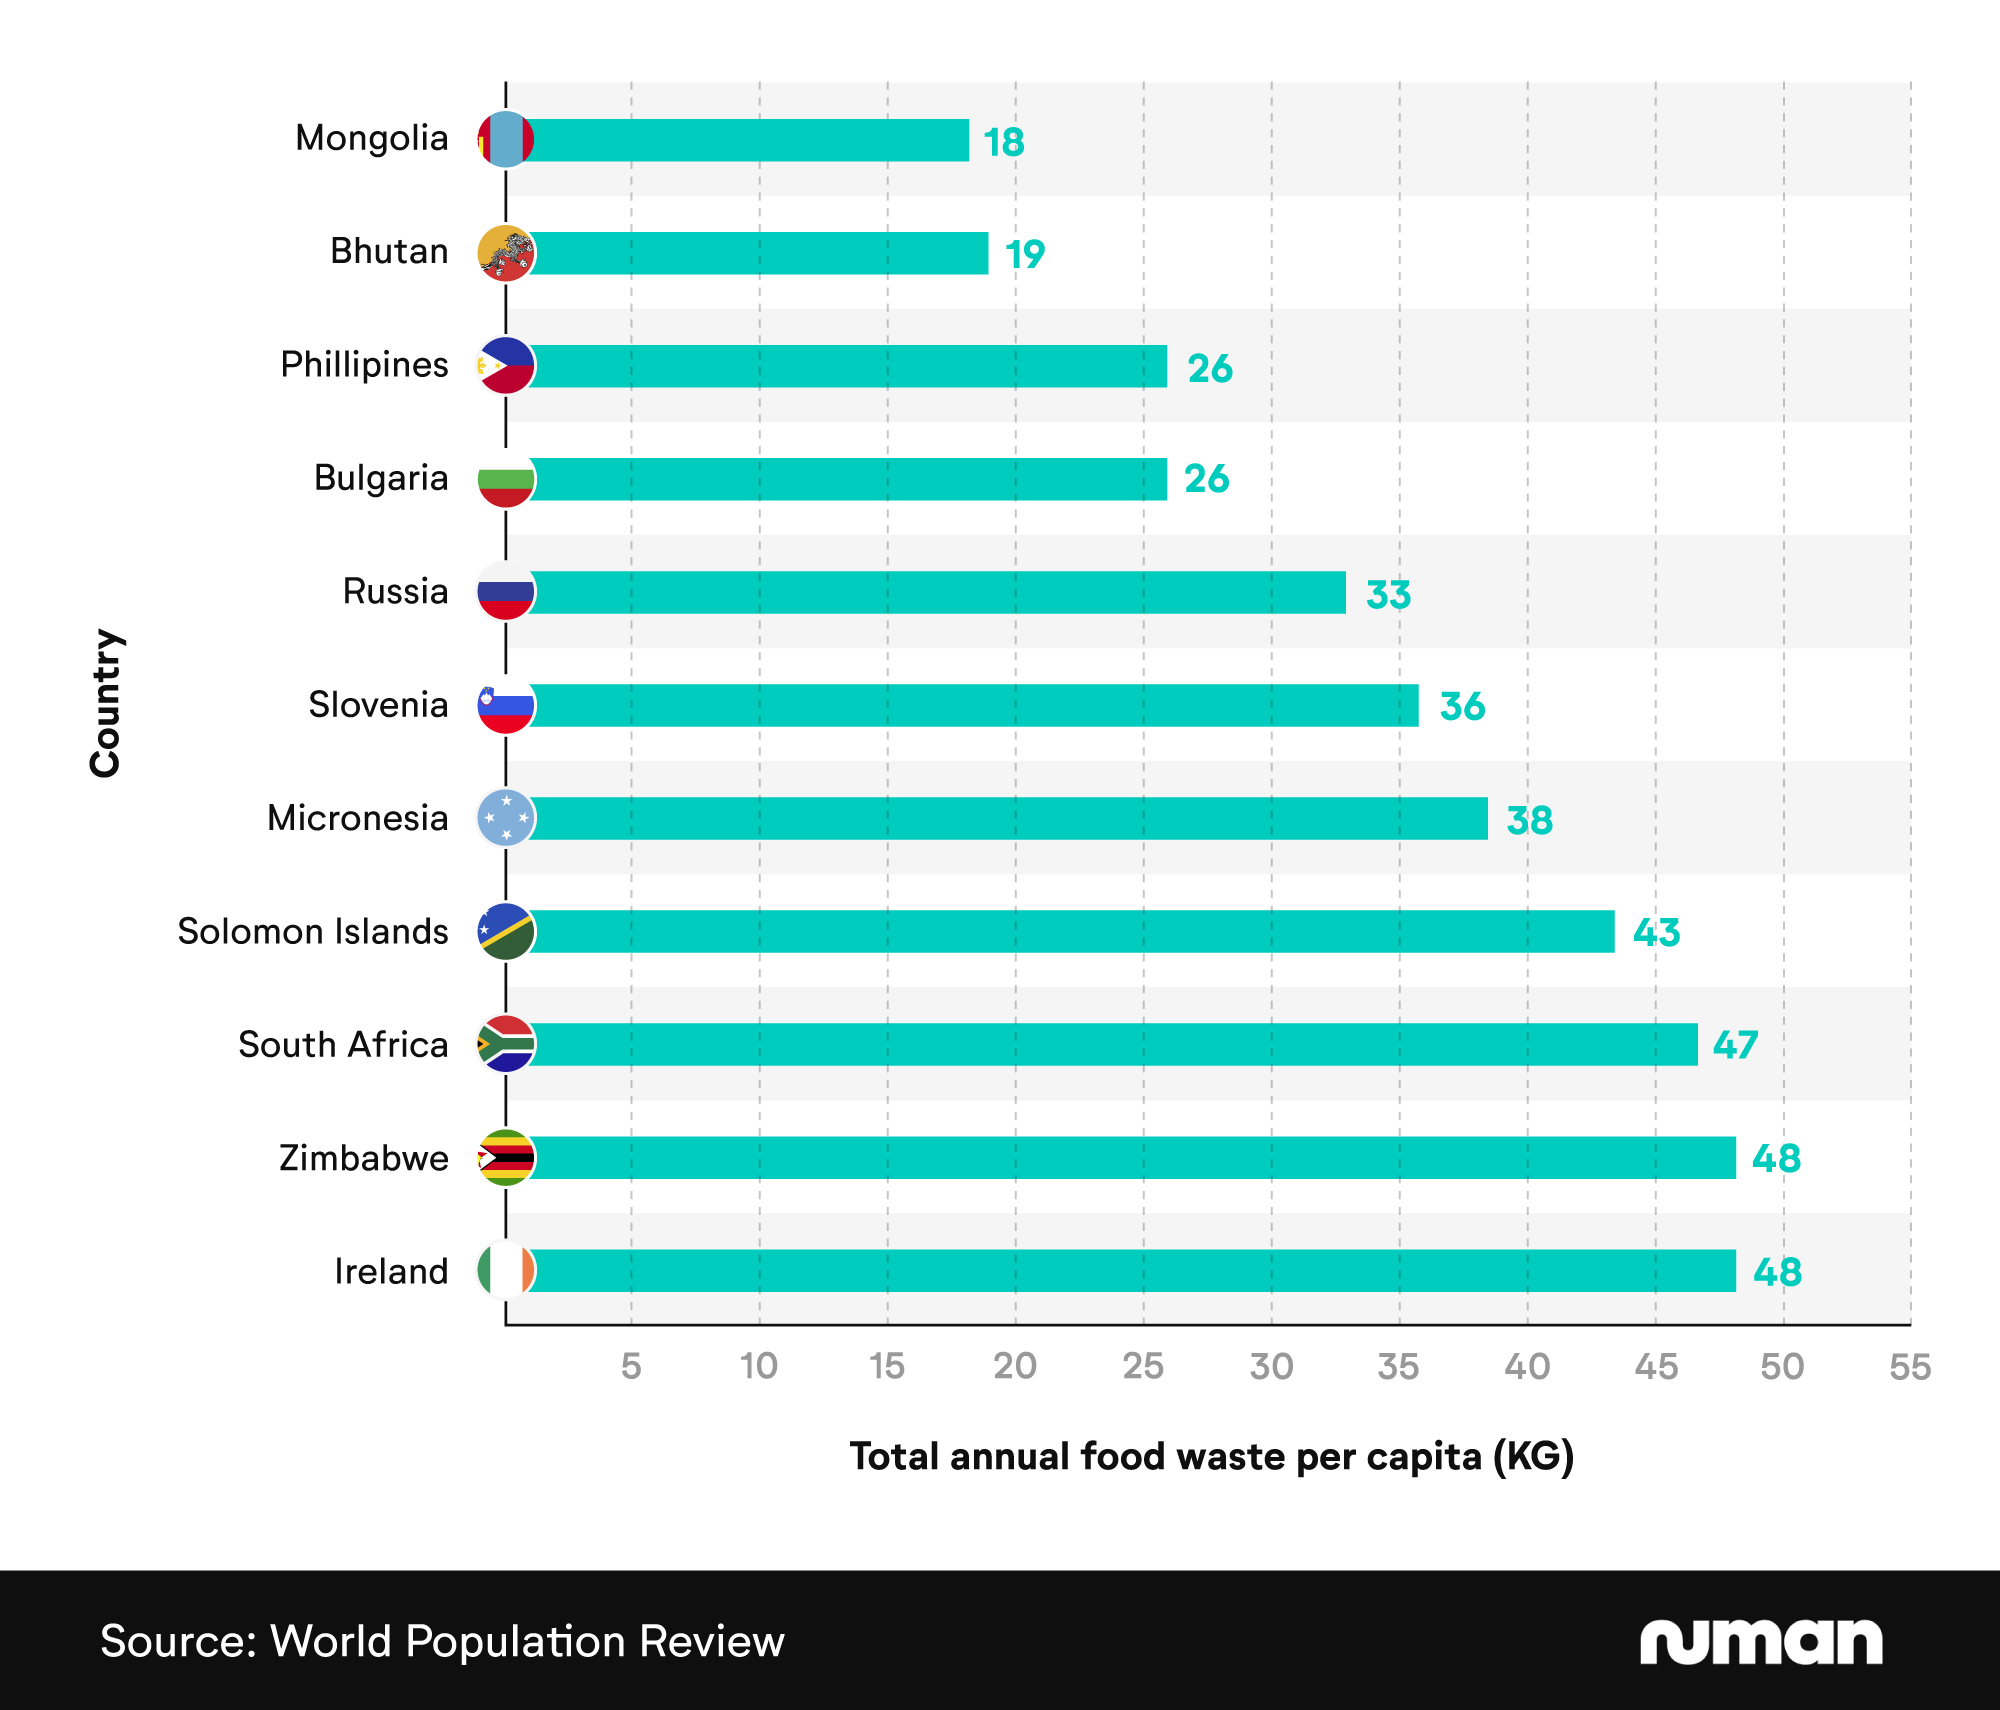
The Philippines and Bulgaria were the final countries with food waste per capita below 30kg, with both recording totals of 26kg.3 Overall, the top ten is geographically diverse, with representation from Asia, Europe, Africa, and Oceania.3
Statistics on different types of food waste
What are the largest sources of food waste?
Food waste facts from WRAP show that 58% of the UK’s wasted food comes from households – over three times more than any other source.1
On-farm food waste was the next most common type (16%), followed by manufacturing (13%). This means that, even when combined, farming and manufacturing are responsible for just half the food waste generated by households.1
The most common sources of food waste in the UK
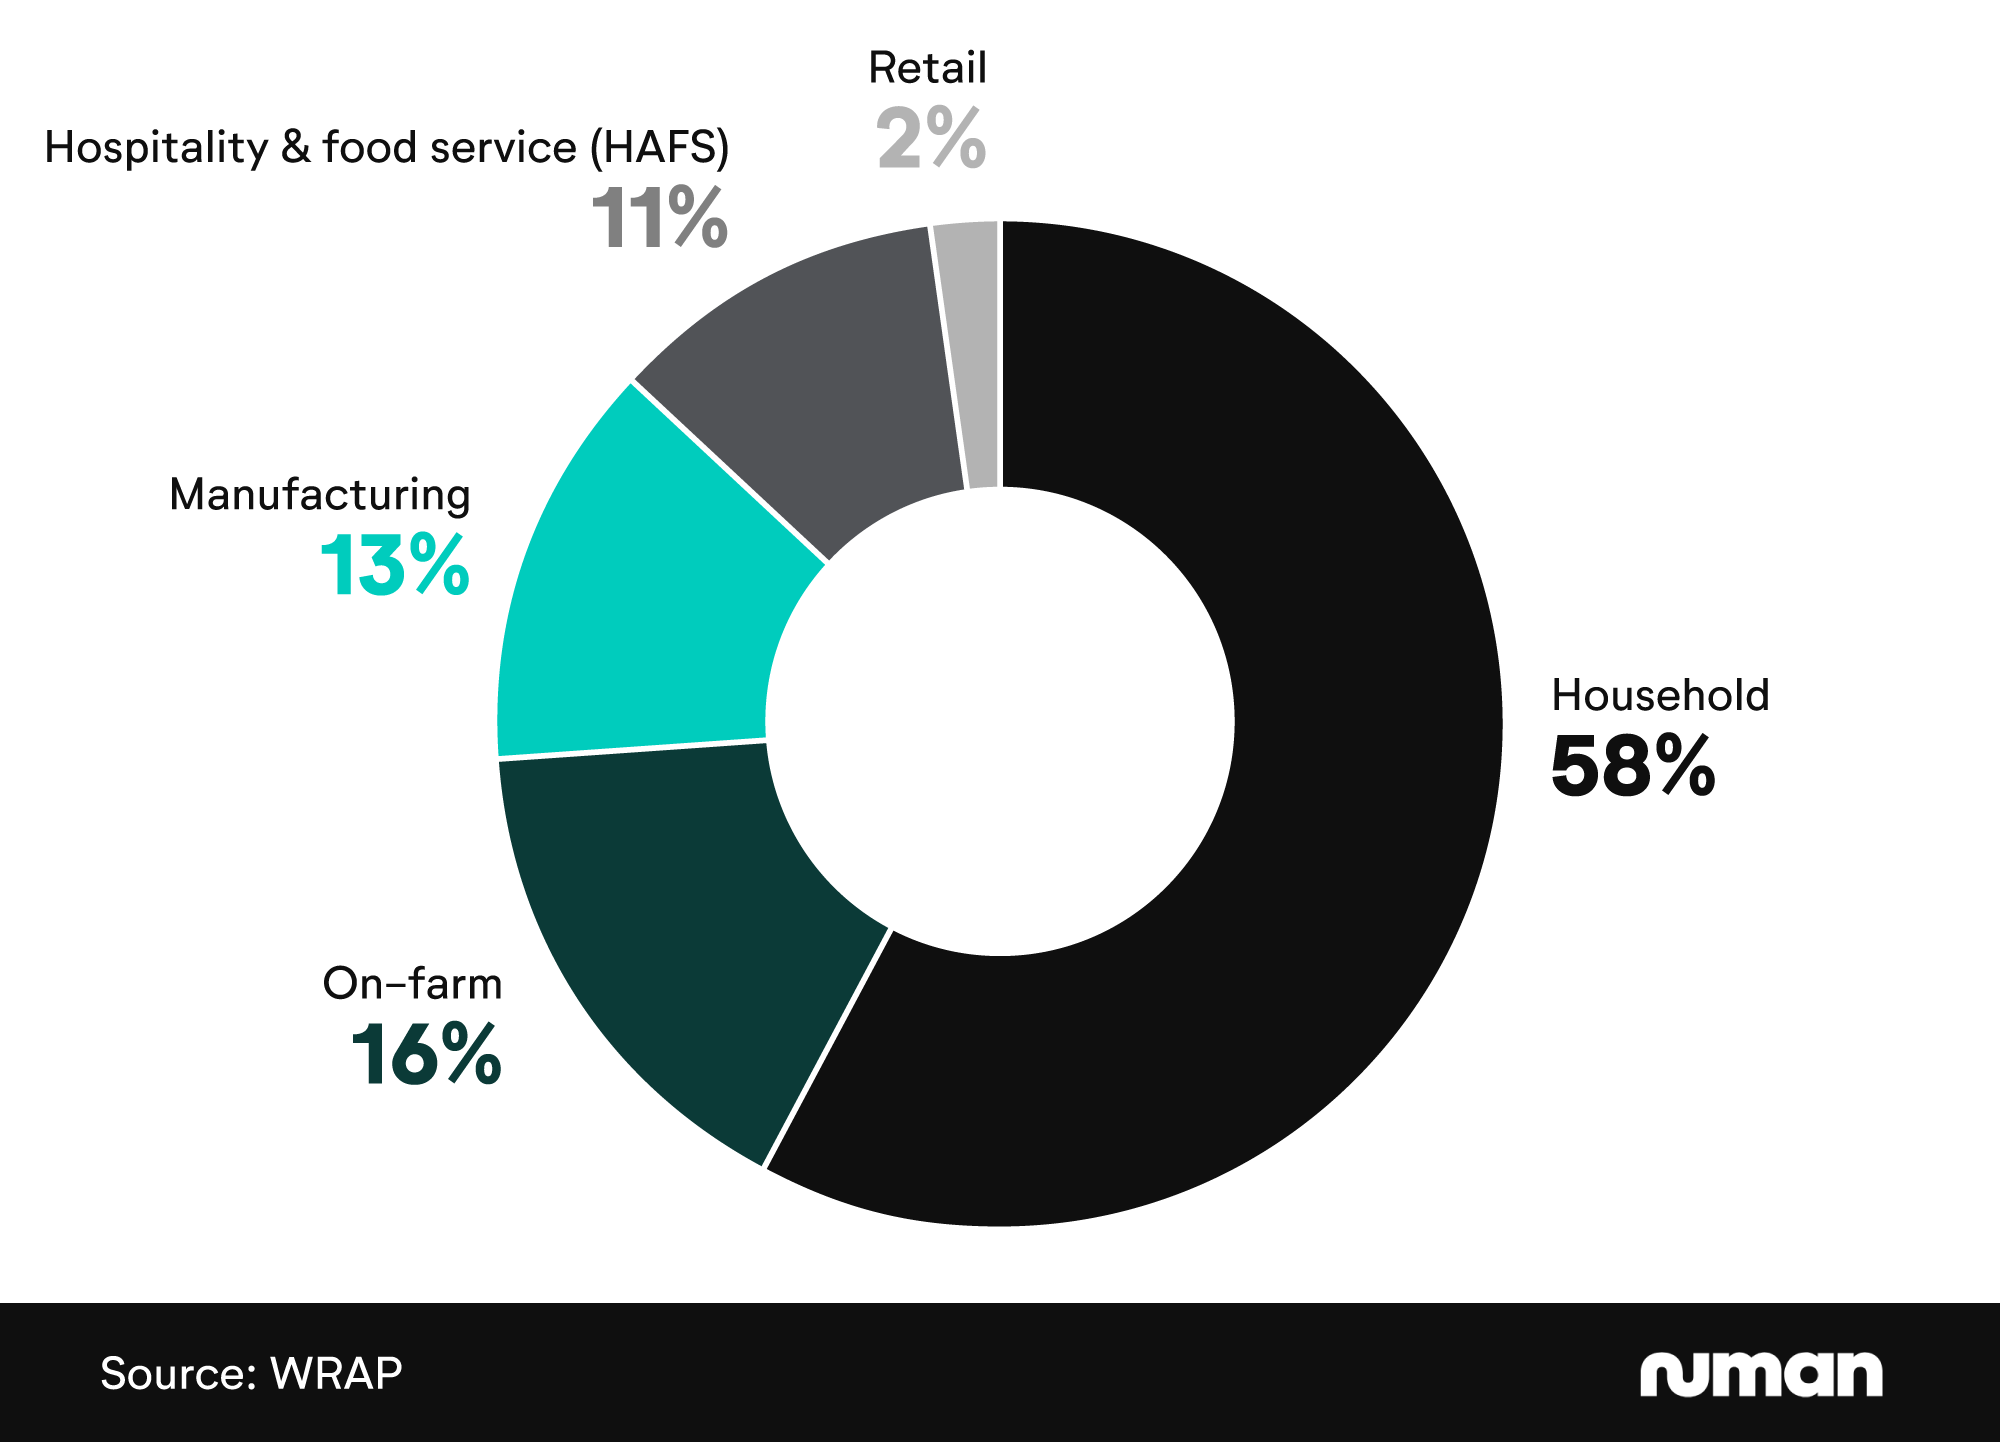
At the other end of the scale, just 2% of UK food waste comes from retail sources like supermarkets, restaurants, and grocery stores. This is eight times less than farming and 29 times fewer than households.1
Most common sources of UK food waste when excluding inedible parts

When excluding inedible parts of food waste, households become an even bigger contributor. Over 70% of edible food waste comes from households – more than five times higher than any other source.1
Total food waste per capita by source, 2007-21
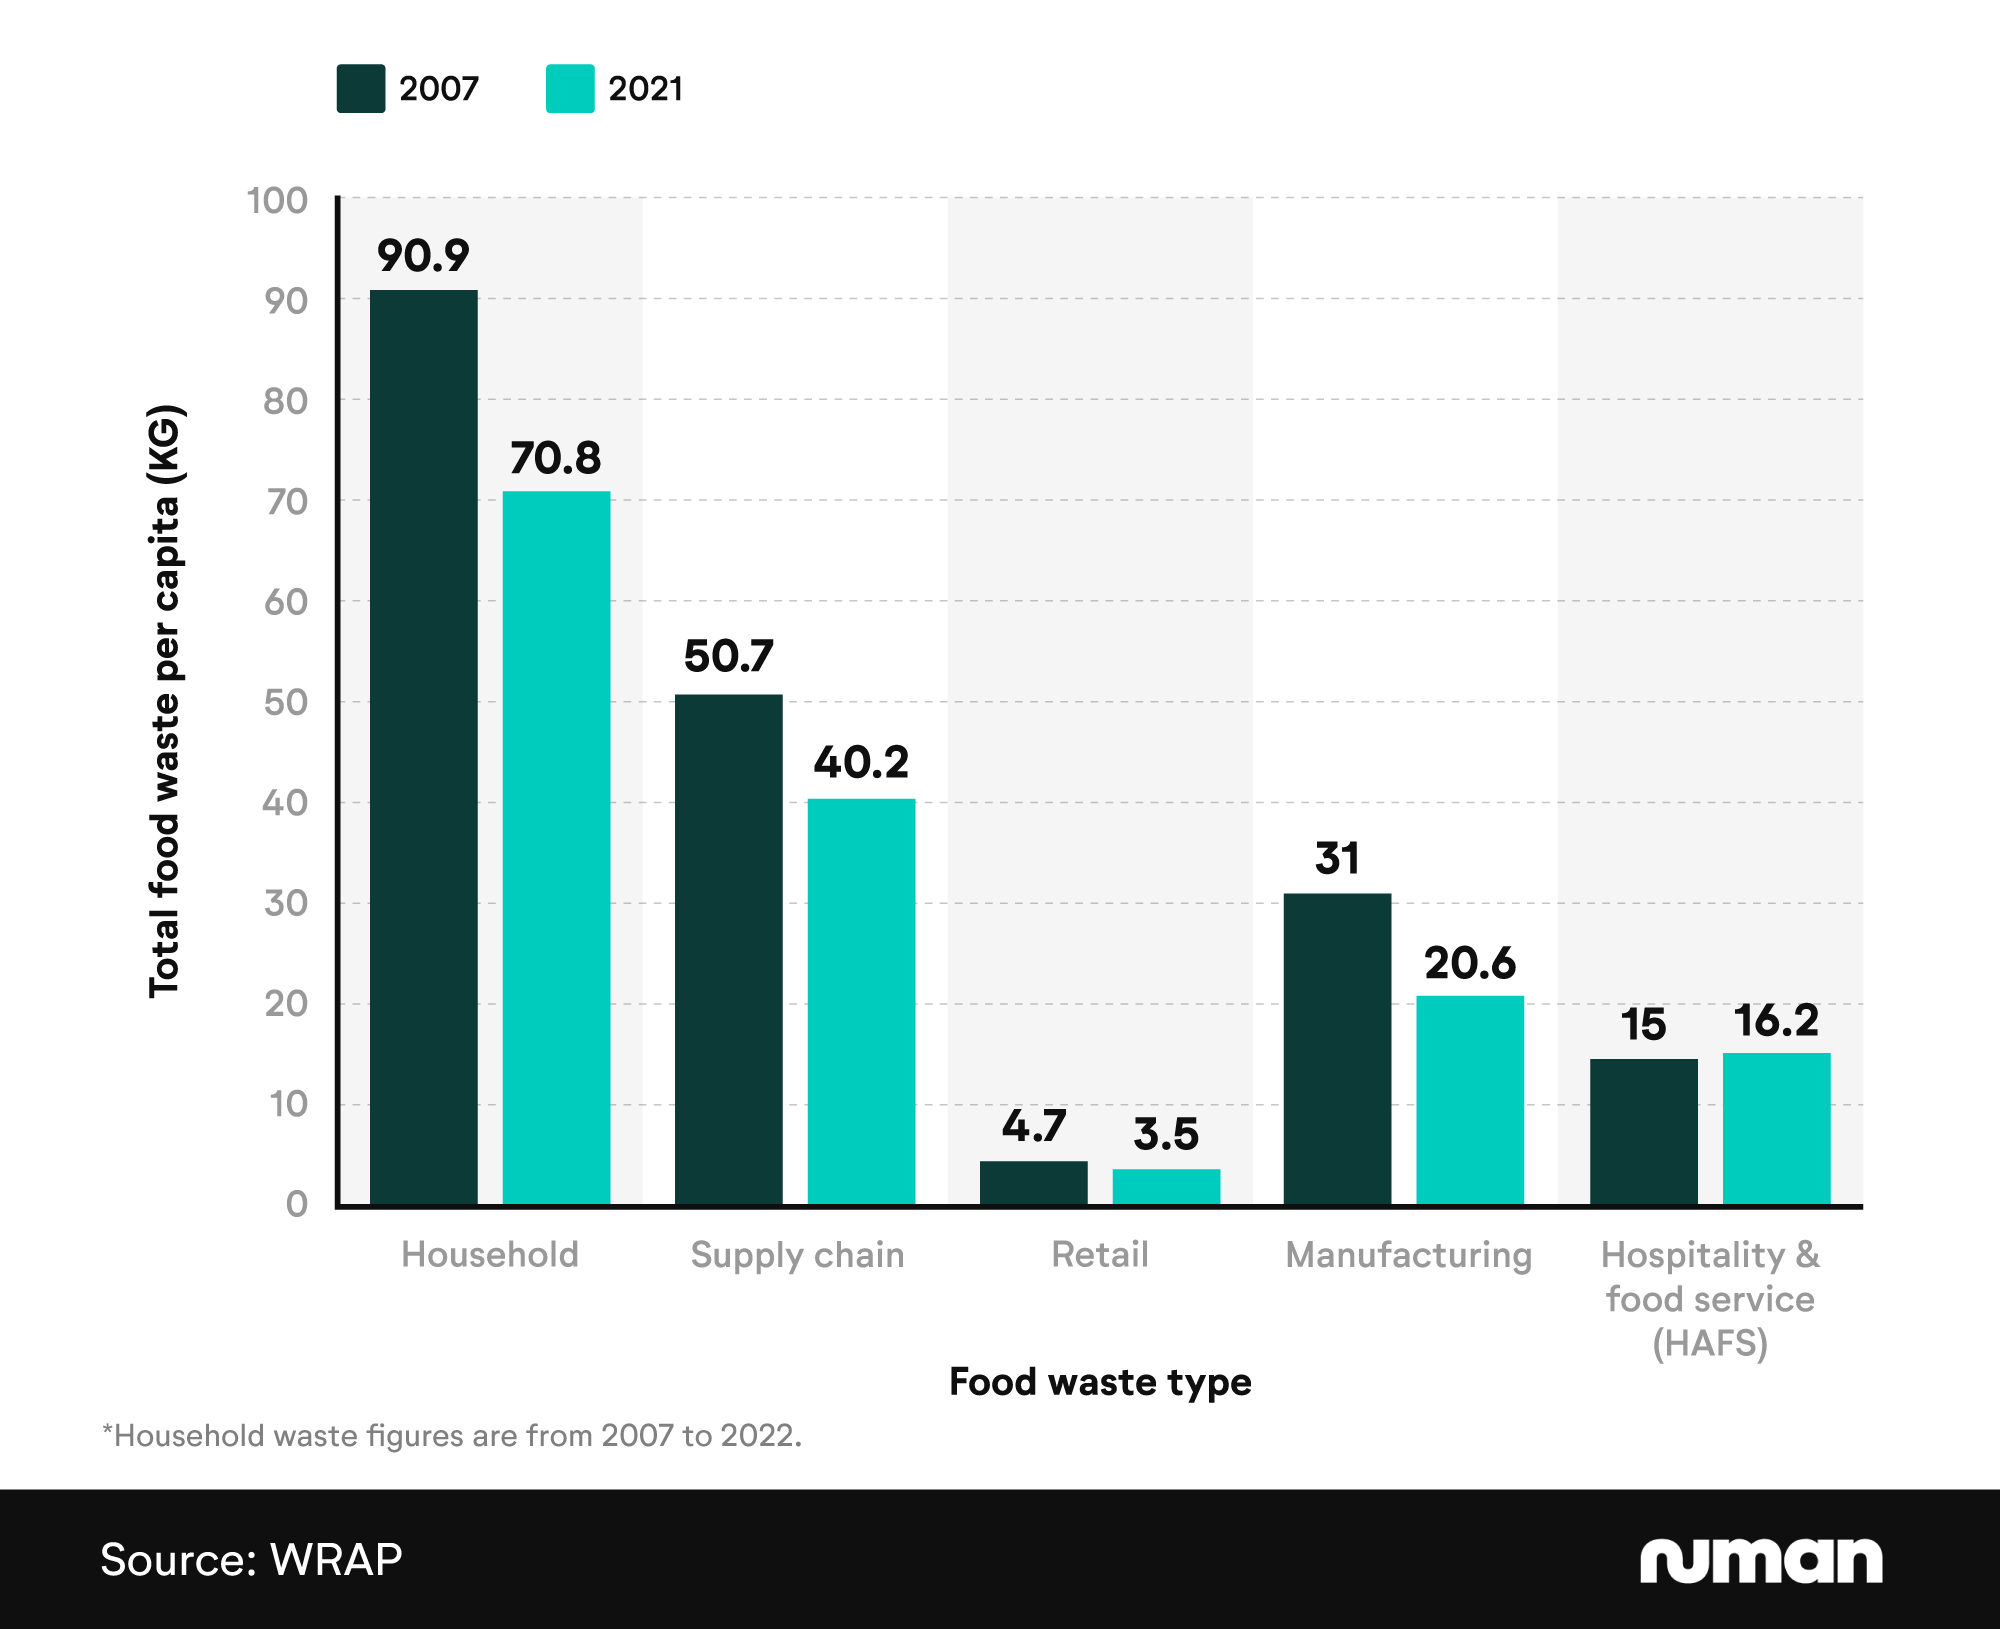
UK household food waste per capita fell 22.1% between 2007 and 2022, from 90.9kg to just under 71kg. However, the biggest fall was seen in the manufacturing of food waste, which dropped by over a third between 2007 and 2021.1
Hospitality and food services were the only sector that saw increases between 2007 and 2021, rising 8% from 15kg to 16.2kg.1
Annual cost of food waste per capita by source
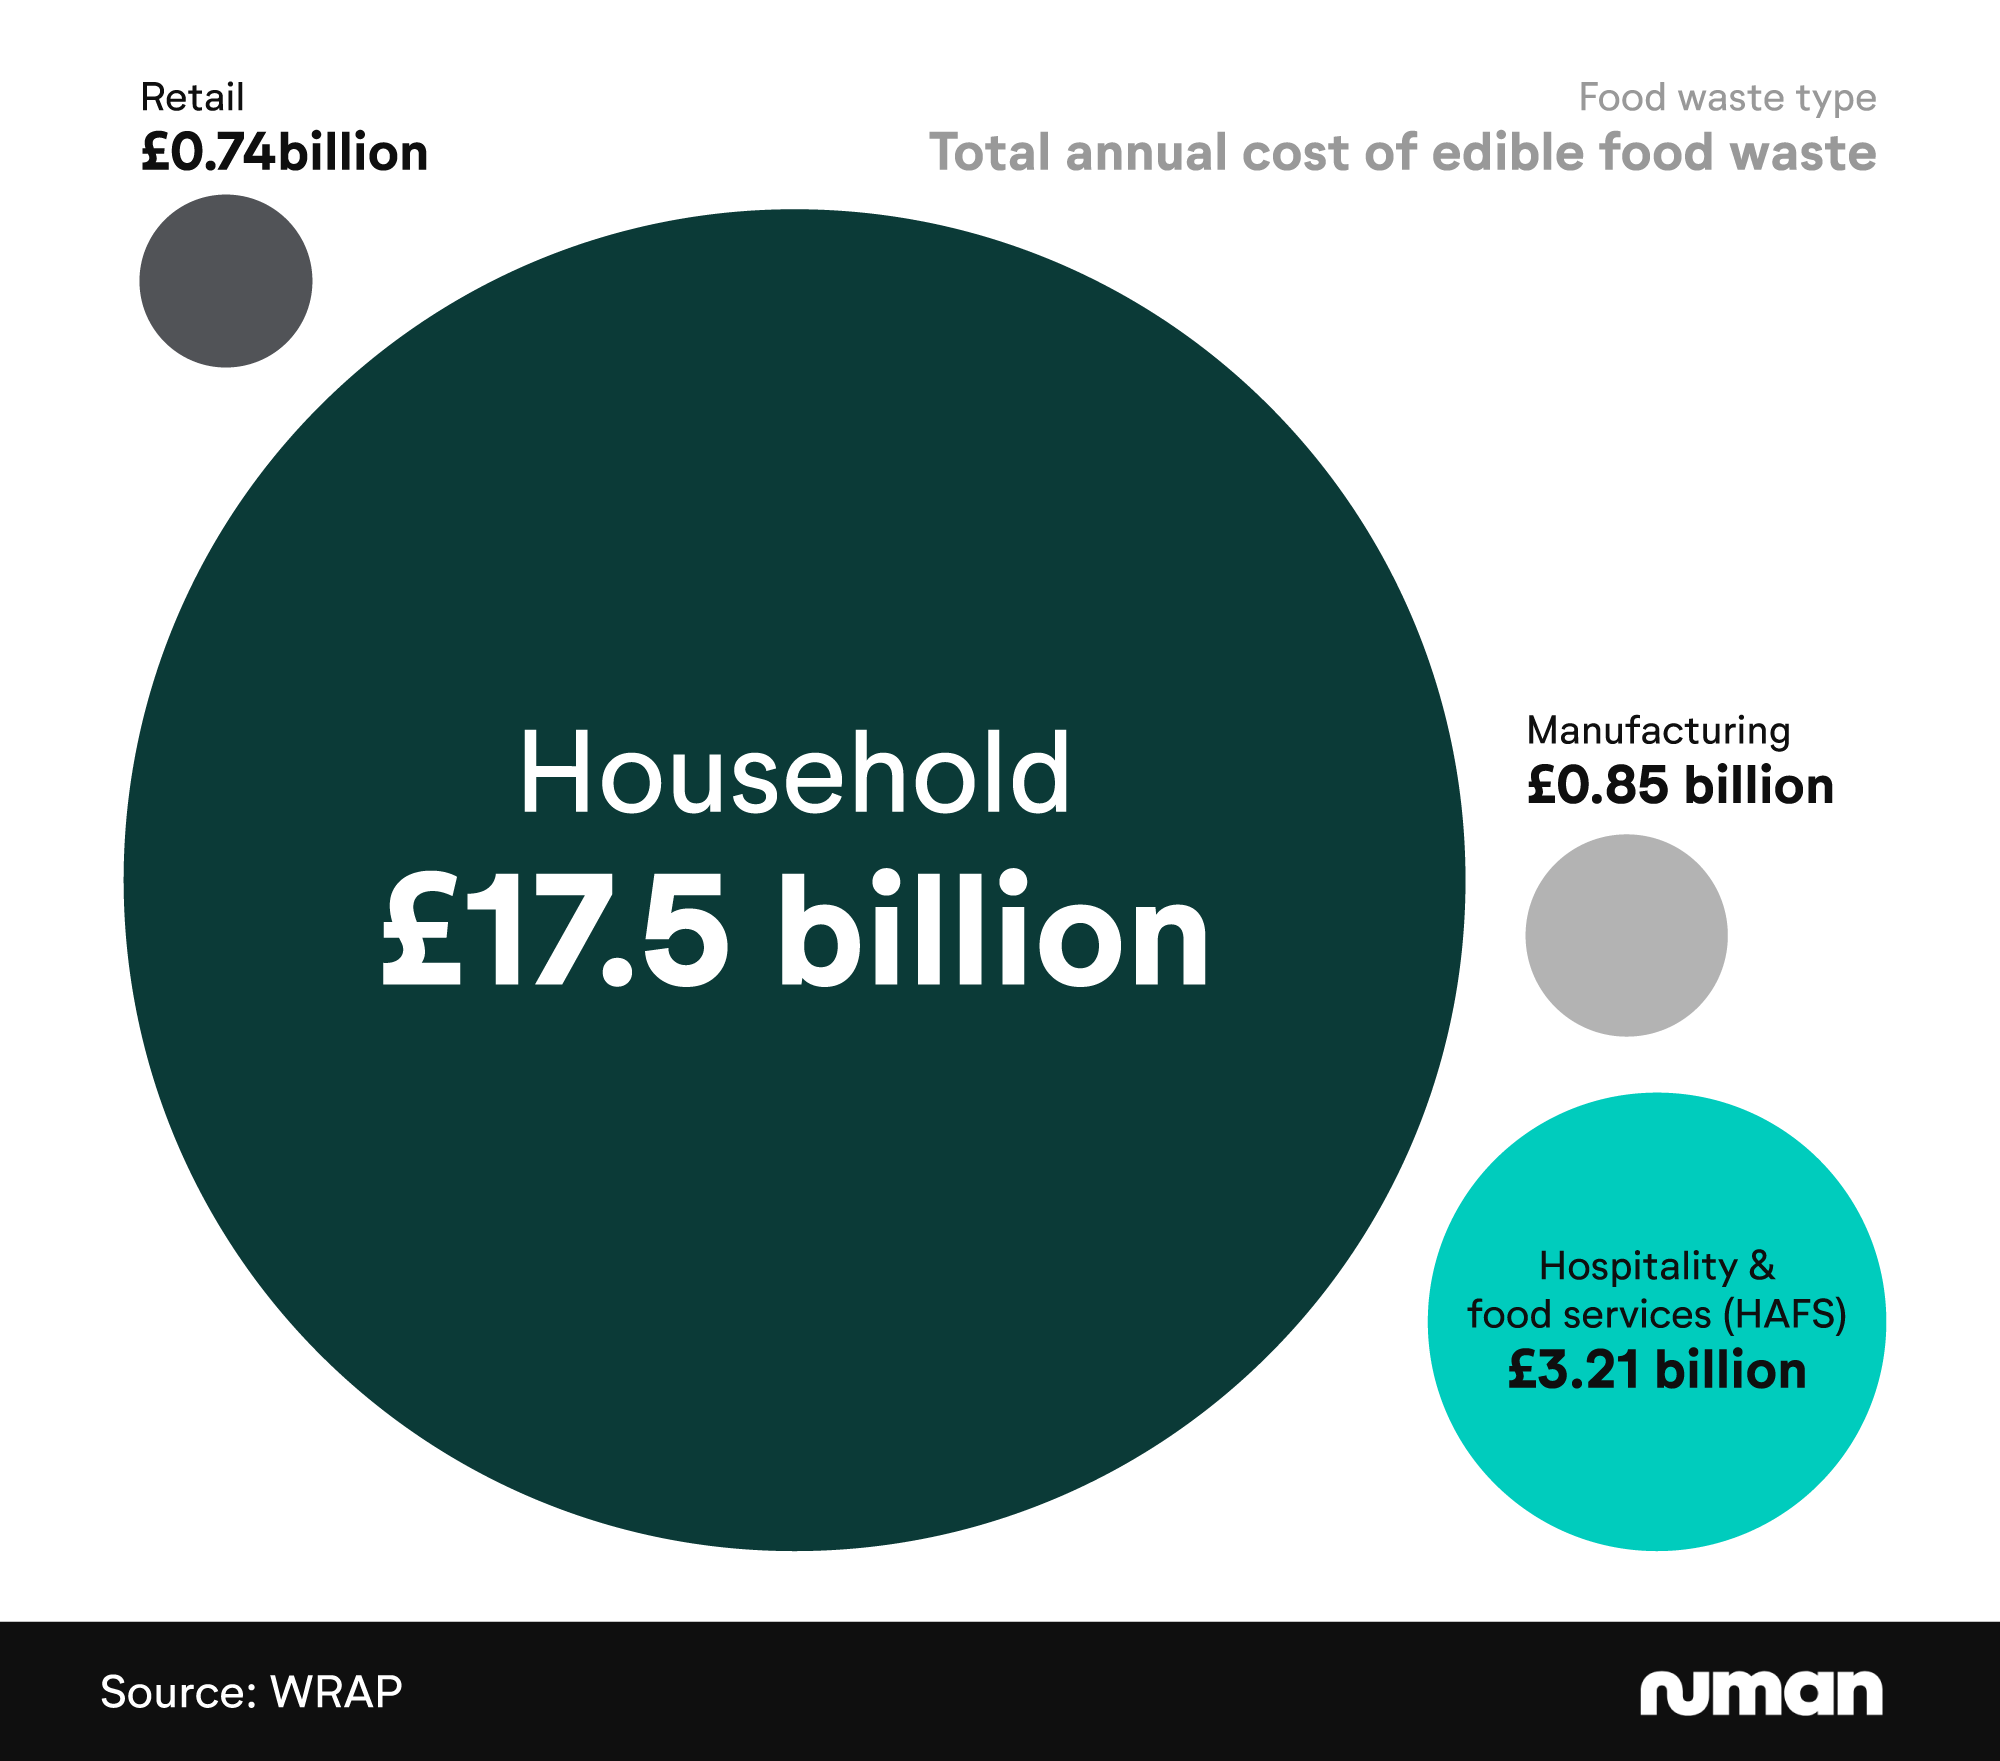
Annual household food waste in the UK was worth a staggering £17.5 billion in 2022. This was over five times more than hospitality and food services – the next most costly source of food waste – at £3.21 billion in 2021.1
Food waste from manufacturing and retail was worth £1.69 billion combined in 2021, just under half the total of hospitality and food services.1
Supermarket food waste statistics in the UK
It’s estimated that the UK retail and food manufacturing sector throws away 100,000 tonnes of edible food per year.12 This comes at a price as supermarkets lose £1 billion per year in food waste.13
The scale of supermarket food waste is validated by a report from The Independent, which claimed that supermarkets discard the equivalent of 190 million meals per year. What’s more, Britain’s top ten supermarket chains donate less than 9% of their consumable food waste, amplifying UK issues around food poverty.4
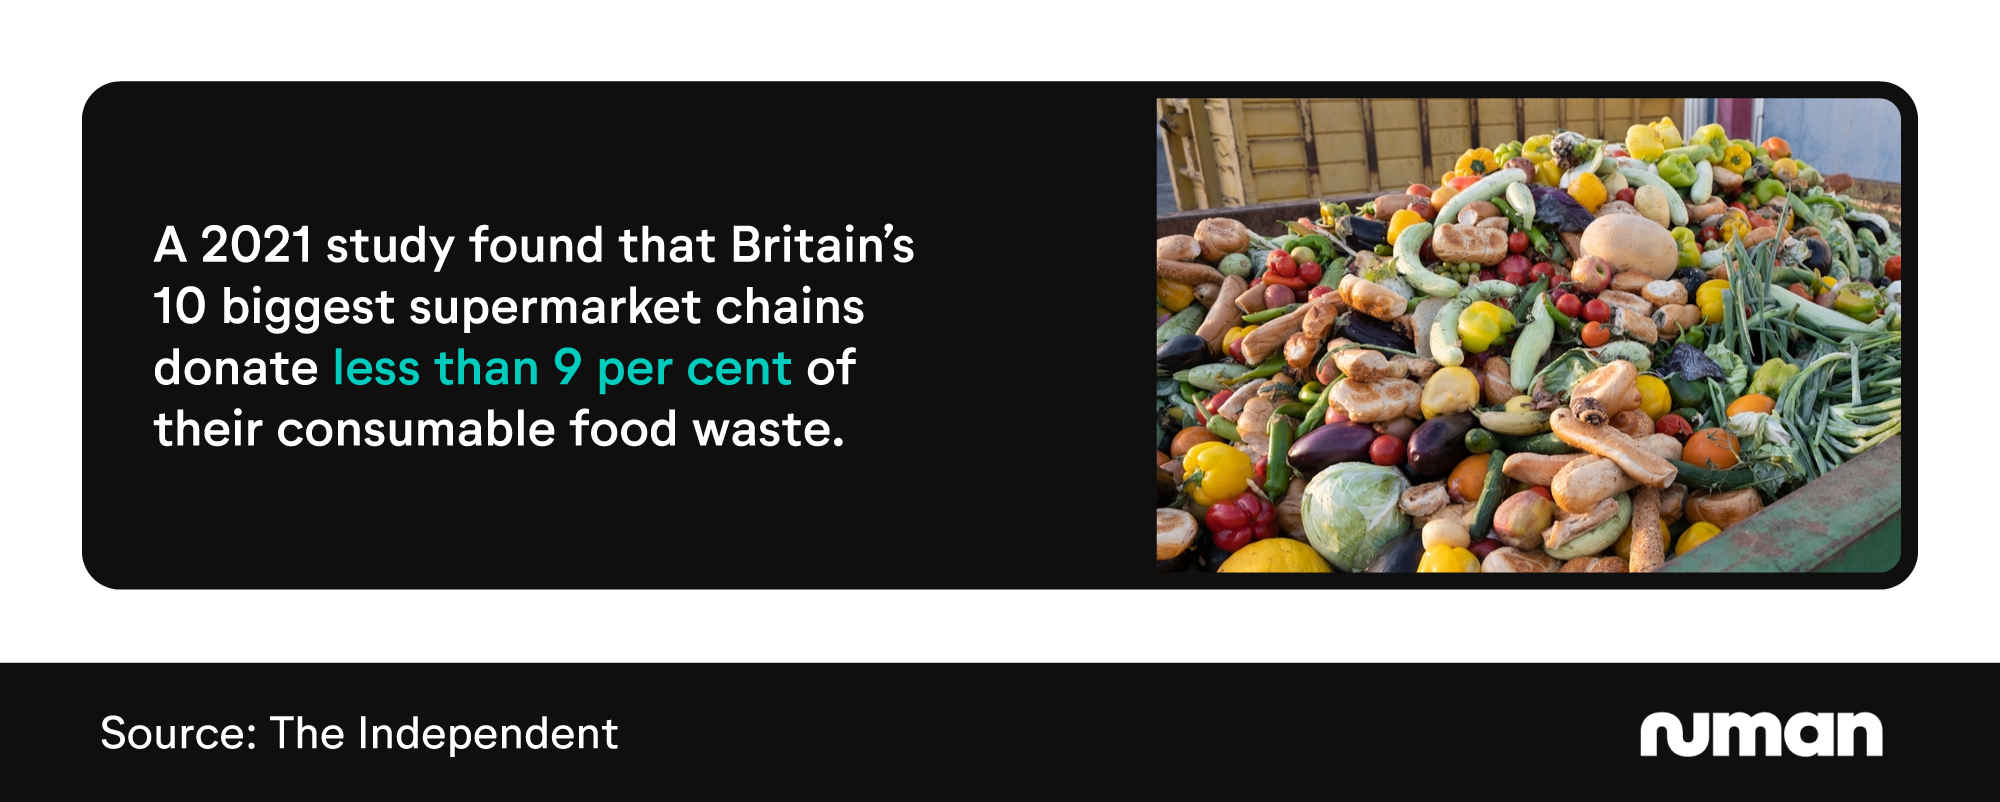
Sainsbury's and Iceland were the worst-performing supermarkets, with donation rates of just 3.8% and 1.7%, respectively. By contrast, Tesco led the way by donating 13.7% of its consumable food waste, with Aldi and the Co-op both exceeding 10%.4
For many, the levels of donation don’t go far enough. A 2022 study found 61% of consumers saying brands, stores, and supermarkets should do more to help reduce waste. Additionally, just under three in five (57%) expressed disappointment with the current efforts made by these outlets.12
What are supermarkets doing to tackle food waste?
Supermarkets have taken several concrete steps to reduce food waste. The UK's biggest chains - Tesco, Sainsbury's, Asda and Morrisons - have pledged to meet the UN goal of halving food waste by 2030.12
This follows a 2019 report that UK supermarkets redistributed over 50,000 tonnes of food to charities and community organisations.12
In 2025, Tesco launched plans to trial giving away free food to shoppers as a way of slashing food waste and meeting net-zero targets. Similar to their current ‘reduced price’ yellow stickers, the supermarket plans to introduce ‘£0 yellow stickers’ that allow shoppers to scan these items at no cost.14
Supermarkets are also now bound by UK Waste Legislation, introduced in March 2025.15 The legislation requires businesses in England to separate food waste from general waste, preventing them from tossing food scraps into a standard waste bin.16
Instead, all food waste must now be collected separately and handled by approved waste collectors.16
Fast food waste statistics
Only 29% of waste from fast food packaging is recovered, despite up to 93% being recoverable in theory.17
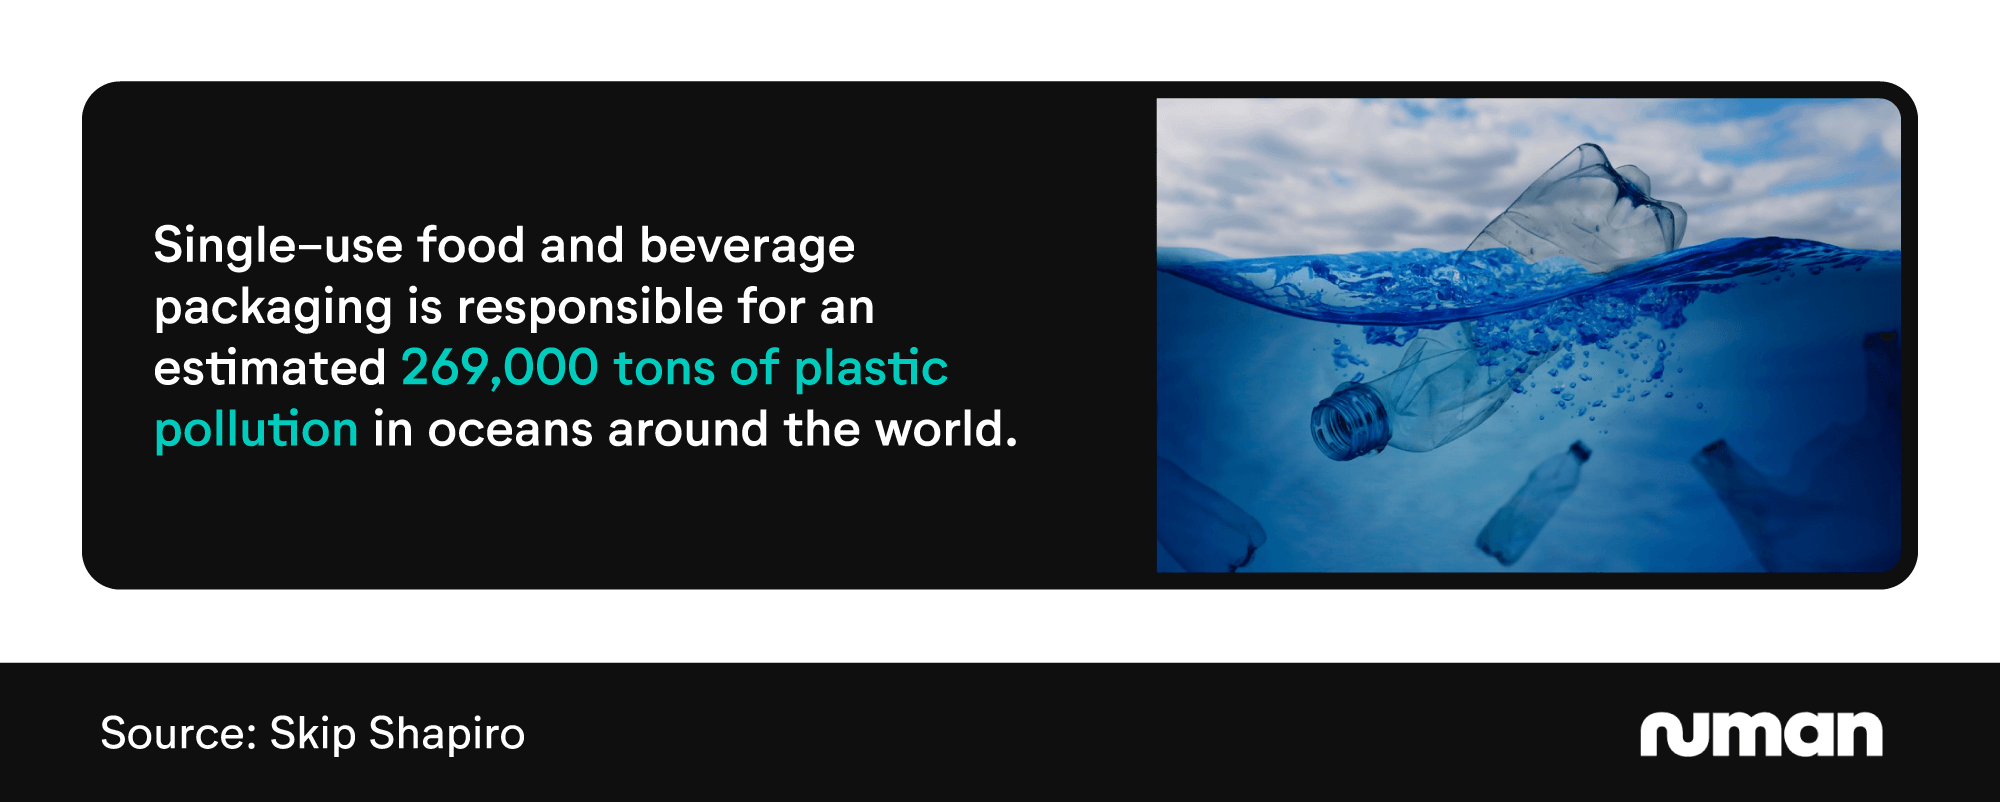
The same report found that less than 14% of plastic packaging gets recycled. The environmental effect of this is huge, with single-use food and drink packaging responsible for an estimated 269,000 tons of plastic pollution in oceans around the world.17
Restaurant waste statistics
Restaurant food waste is responsible for 15% of all food that ends up in landfills. The cost of this is significant, with restaurants in the US alone generating $25 billion worth of food waste each year.17
Food waste costs US restaurants a combined $162 million per year, meaning reduction is key to maximising profit. In fact, every dollar of saved food results in an average additional revenue of $14, according to recent statistics.18
Food waste reduction is supported by the public, with over nine in ten (91%) consumers preferring to purchase from businesses that reduce food waste.18
What is the most wasted food in the UK?
Potatoes are by far the most wasted food in the UK, generating an average of 1,300 tonnes of waste per day. This means that potatoes are responsible for roughly 480,000 tonnes of food waste per year – nearly 5% of the annual UK total.1
The most wasted types of food in the UK
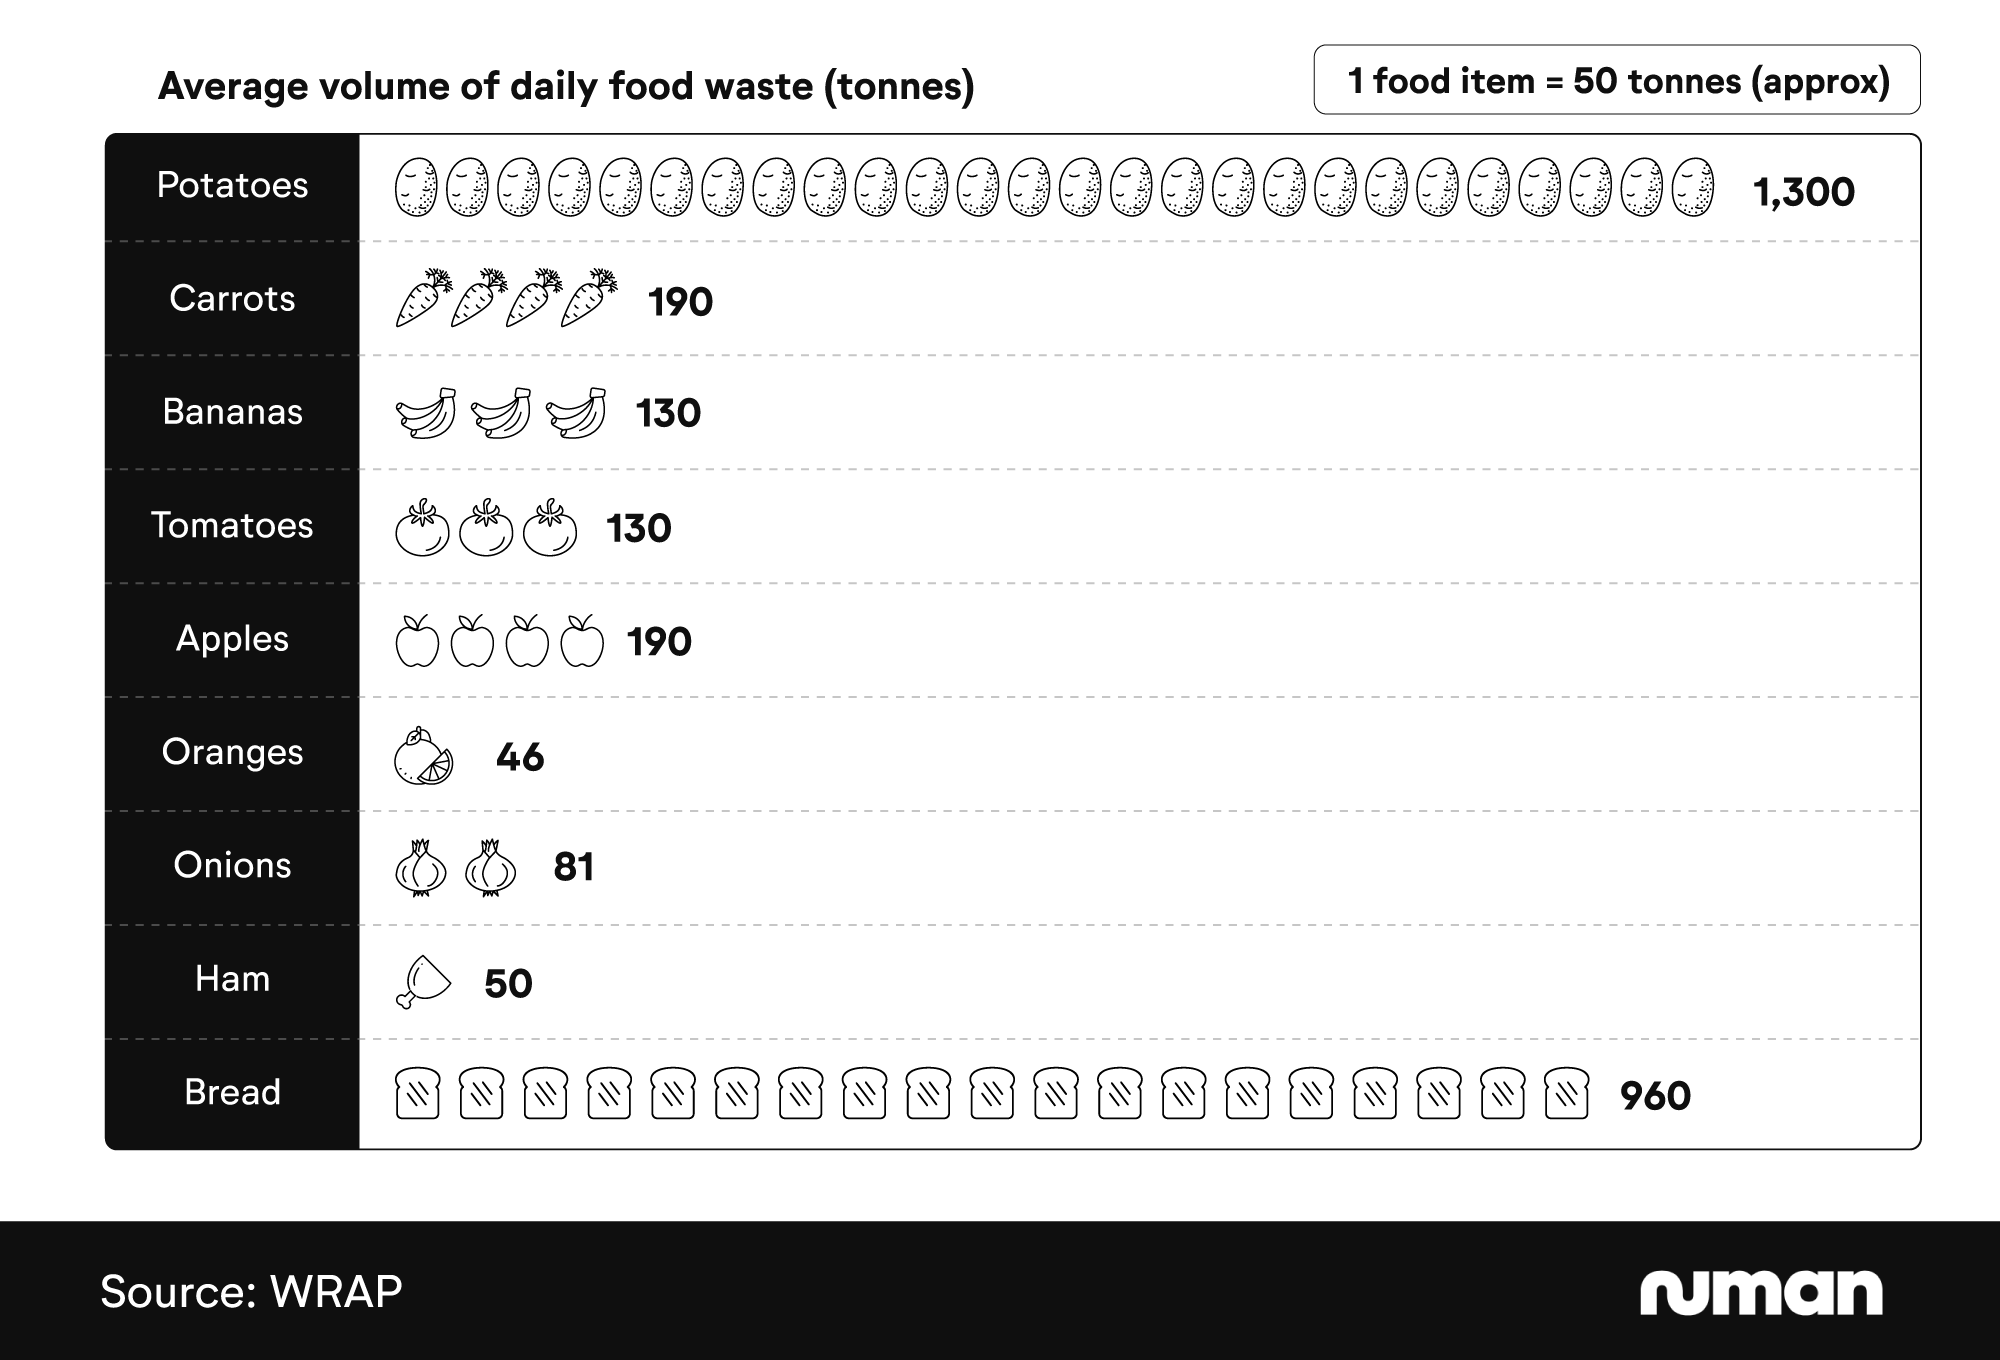
Bread was the next most wasted, generating 960 tonnes of food waste per day, on average. This was over five times more than any other food, making it one of two foods to generate more than 500 tonnes of waste per day.1
The remainder of the top five are fruits and vegetables, with carrots, apples, tomatoes, and bananas all generating between 100 and 200 tonnes of daily waste.1
Food waste prevention statistics
What is being done to reduce food waste?
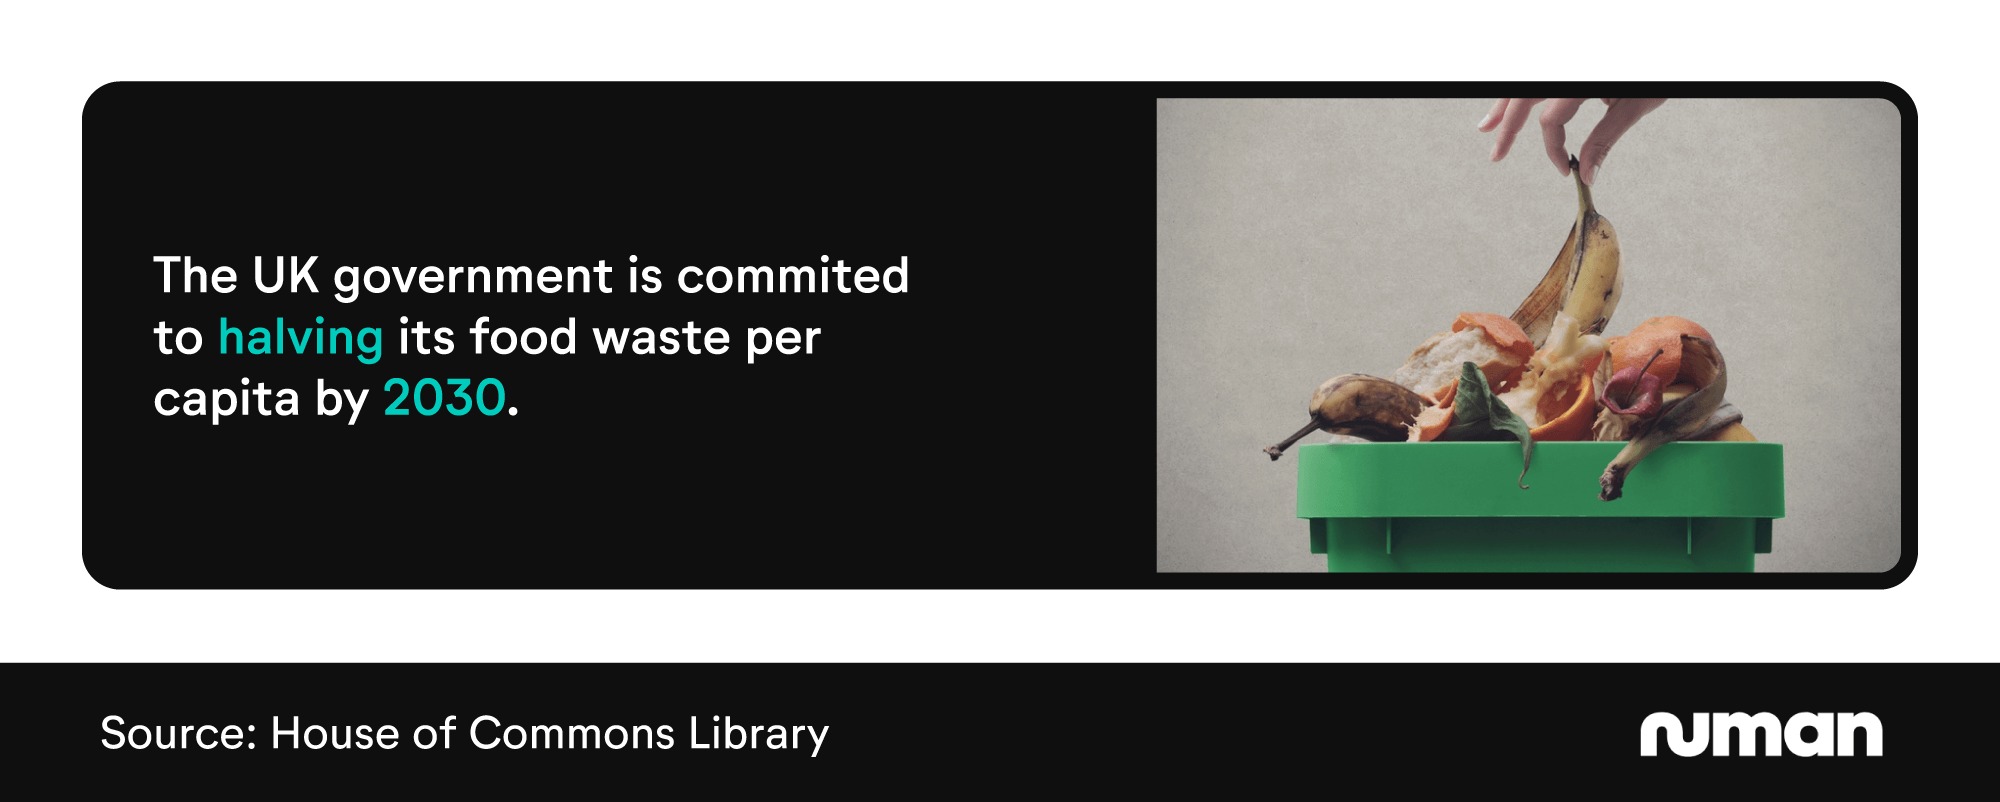
Governments, charities, and public bodies are taking action to cut food waste. The UK has committed to halving its food waste per capita by 2030, under the UN’s State of Development Goals.19
Campaigns like Love Food Hate Waste teach people how to buy, store, and use food more efficiently. Additionally, it’s hoped that the 2025 business waste regulation changes will help drive a significant reduction in food waste.16
The legislation requires businesses in England to separate food waste from general rubbish and have it collected by a licensed food waste handler.16
Food waste recycling statistics
Recent food waste statistics from Keenan Recycling revealed that 43.6% of UK food waste is recycled. However, this number drops below 35% when considering only household food waste, highlighting the need to establish more efficient food waste practices at home.20
UK food waste recycling statistics3
When broken down by country, Wales has the highest food waste recycling rate in the UK, at 55.8%. This was over nine percentage points more than second-placed Scotland (46.2%), making Wales the only UK nation that recycles more than half of its food waste.20
Northern Ireland had the lowest recycling rate in the UK, at 38.3% – 2.5 percentage points lower than England (40.8%).20
| Fact | Value |
|---|---|
| Overall food waste recycling rate | 43.6% |
| Household food waste recycling rate | 34.5% |
| Food waste recycling rate in Wales | 55.8% |
| Food waste recycling rate in Scotland | 46.2% |
| Food waste recycling rate in England | 40.8% |
| Food waste recycling rate in Northern Ireland | 38.3% |
| Compost produced through food waste recycling | 1.8 million tonnes per year |
| Biogas produced through anaerobic digestion | 2.6 TWh per year |
Food waste management market statistics
The global food waste management market was valued at over $70 billion in 2024.21 North America had the largest market of any continent, with an overall value of $28.11 billion – over 40% of the global market share.21
Europe’s market value of $21.08 billion gave it a market share of over 30%, while Asia’s total of $16.16 billion meant it occupied just under a quarter (23%) of the global industry.
With comparably less investment into food management compared to Europe and the Americas, it’s no surprise that Asia is home to the country with the highest overall food waste (China) and the highest food waste per capita (Maldives).21
Global value of the food waste management market, 2024-2031
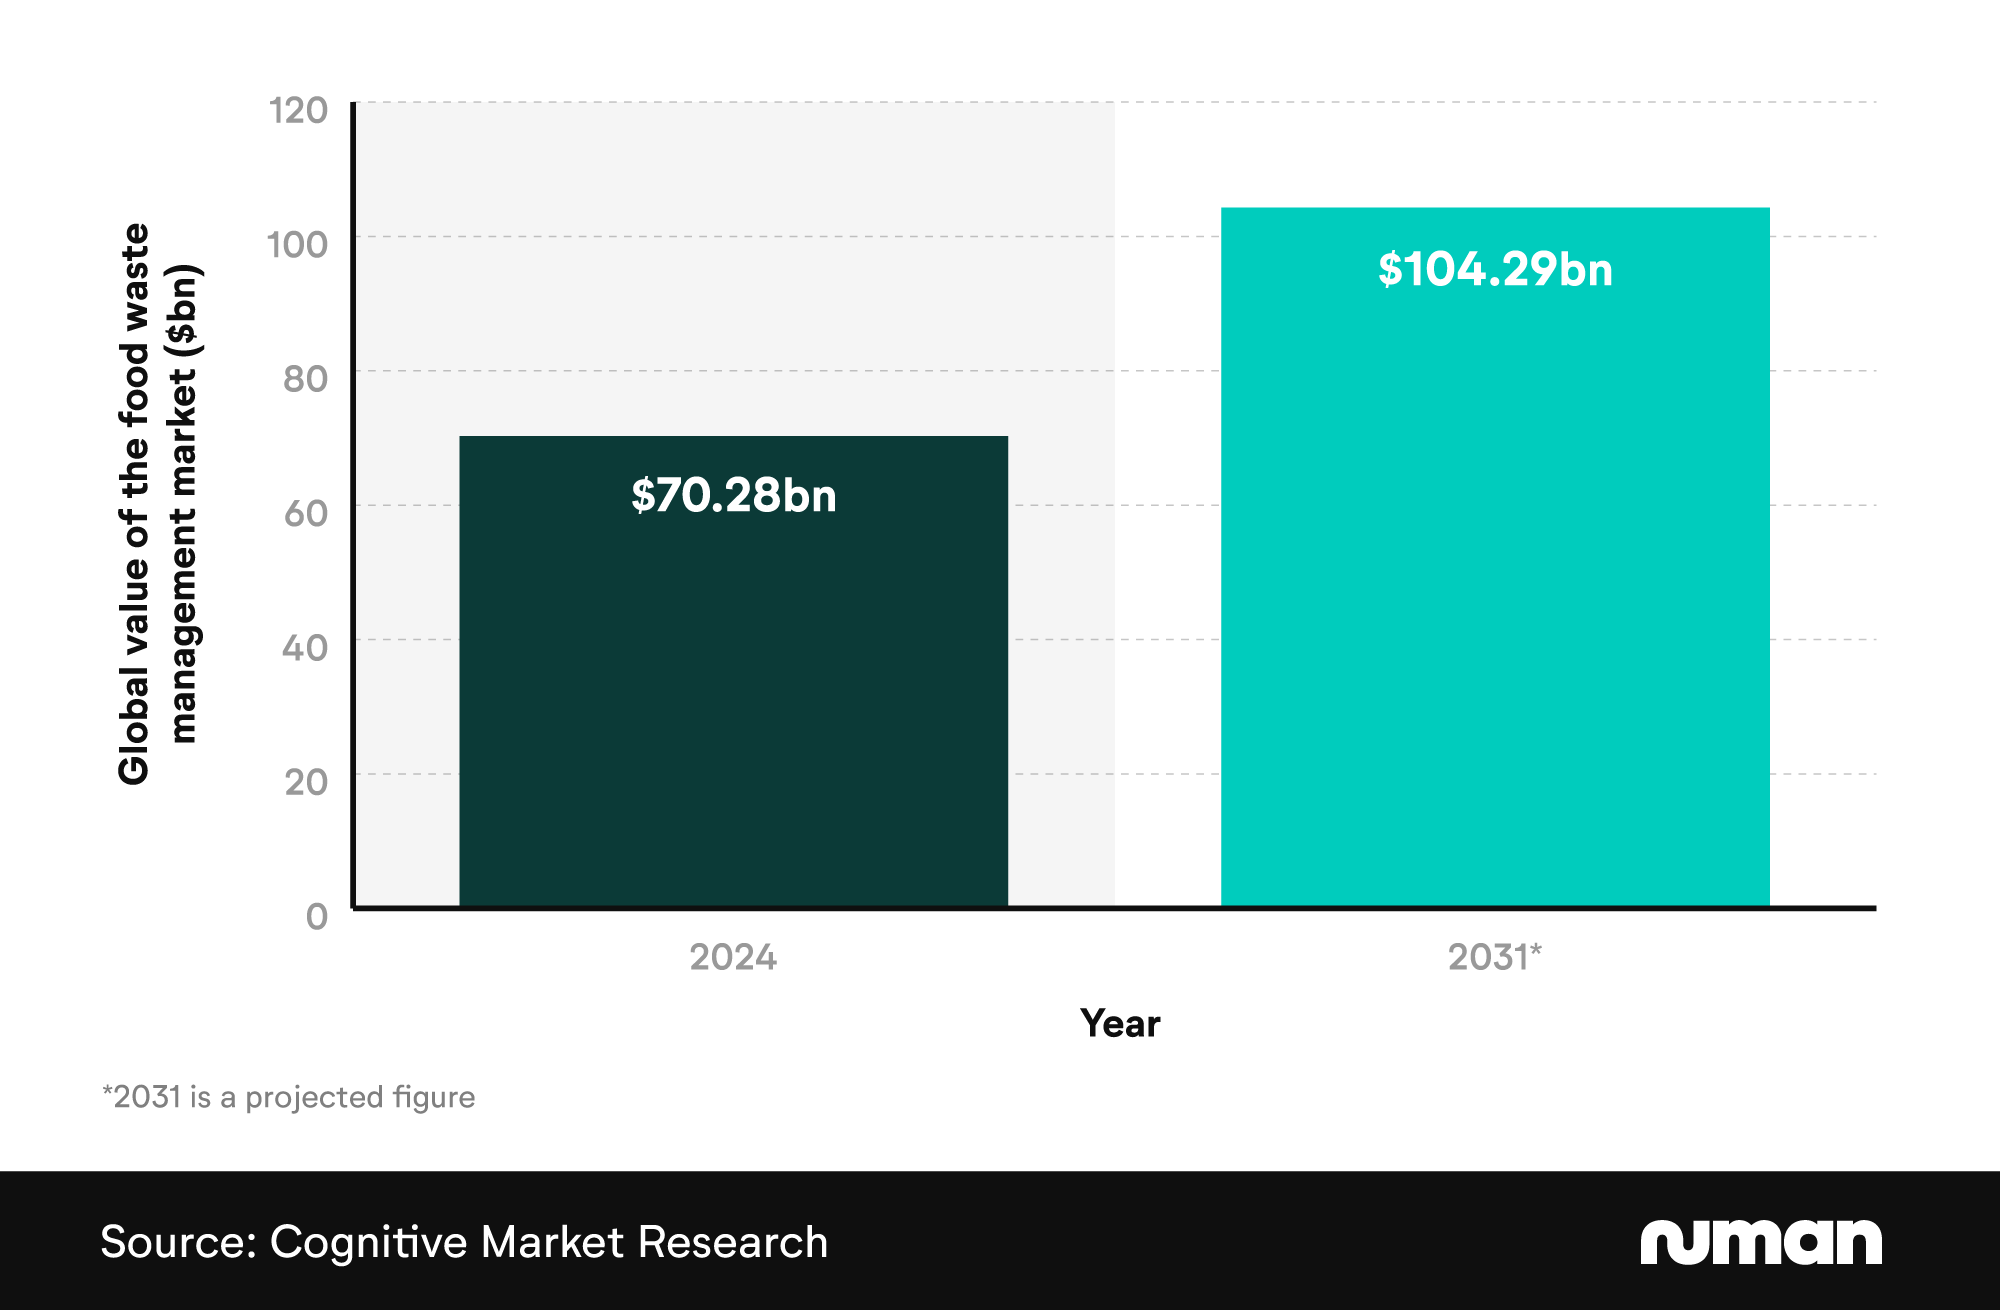
The food waste management market is expected to grow in the coming years, experiencing a compound annual growth rate (CAGR) of 5.8% between 2024 and 2031. If correct, then global industry value will exceed $104 billion by 2031.21
How has interest in food waste management changed over time?
Our independent study shows that search interest in food waste recycling fluctuated regularly between 2015 and 2025. After recording an average search volume of 231 in September 2015, the numbers more than doubled to 577 in 2016, before falling back below 300 a year later.
Figures would remain erratic over the next eight years, with September 2025's total of 533, the highest total recorded since 2016. Numbers are projected to climb in future years, reaching 591 in 2026 before jumping to 780 by 2030.
If correct, then UK search volumes for food waste recycling in September 2030 will be 46% higher than in 2025 and more than triple the total of 2015.
Average keyword volume for the term ‘Food Waste Recycling’ by country, September 2015 to September 2030
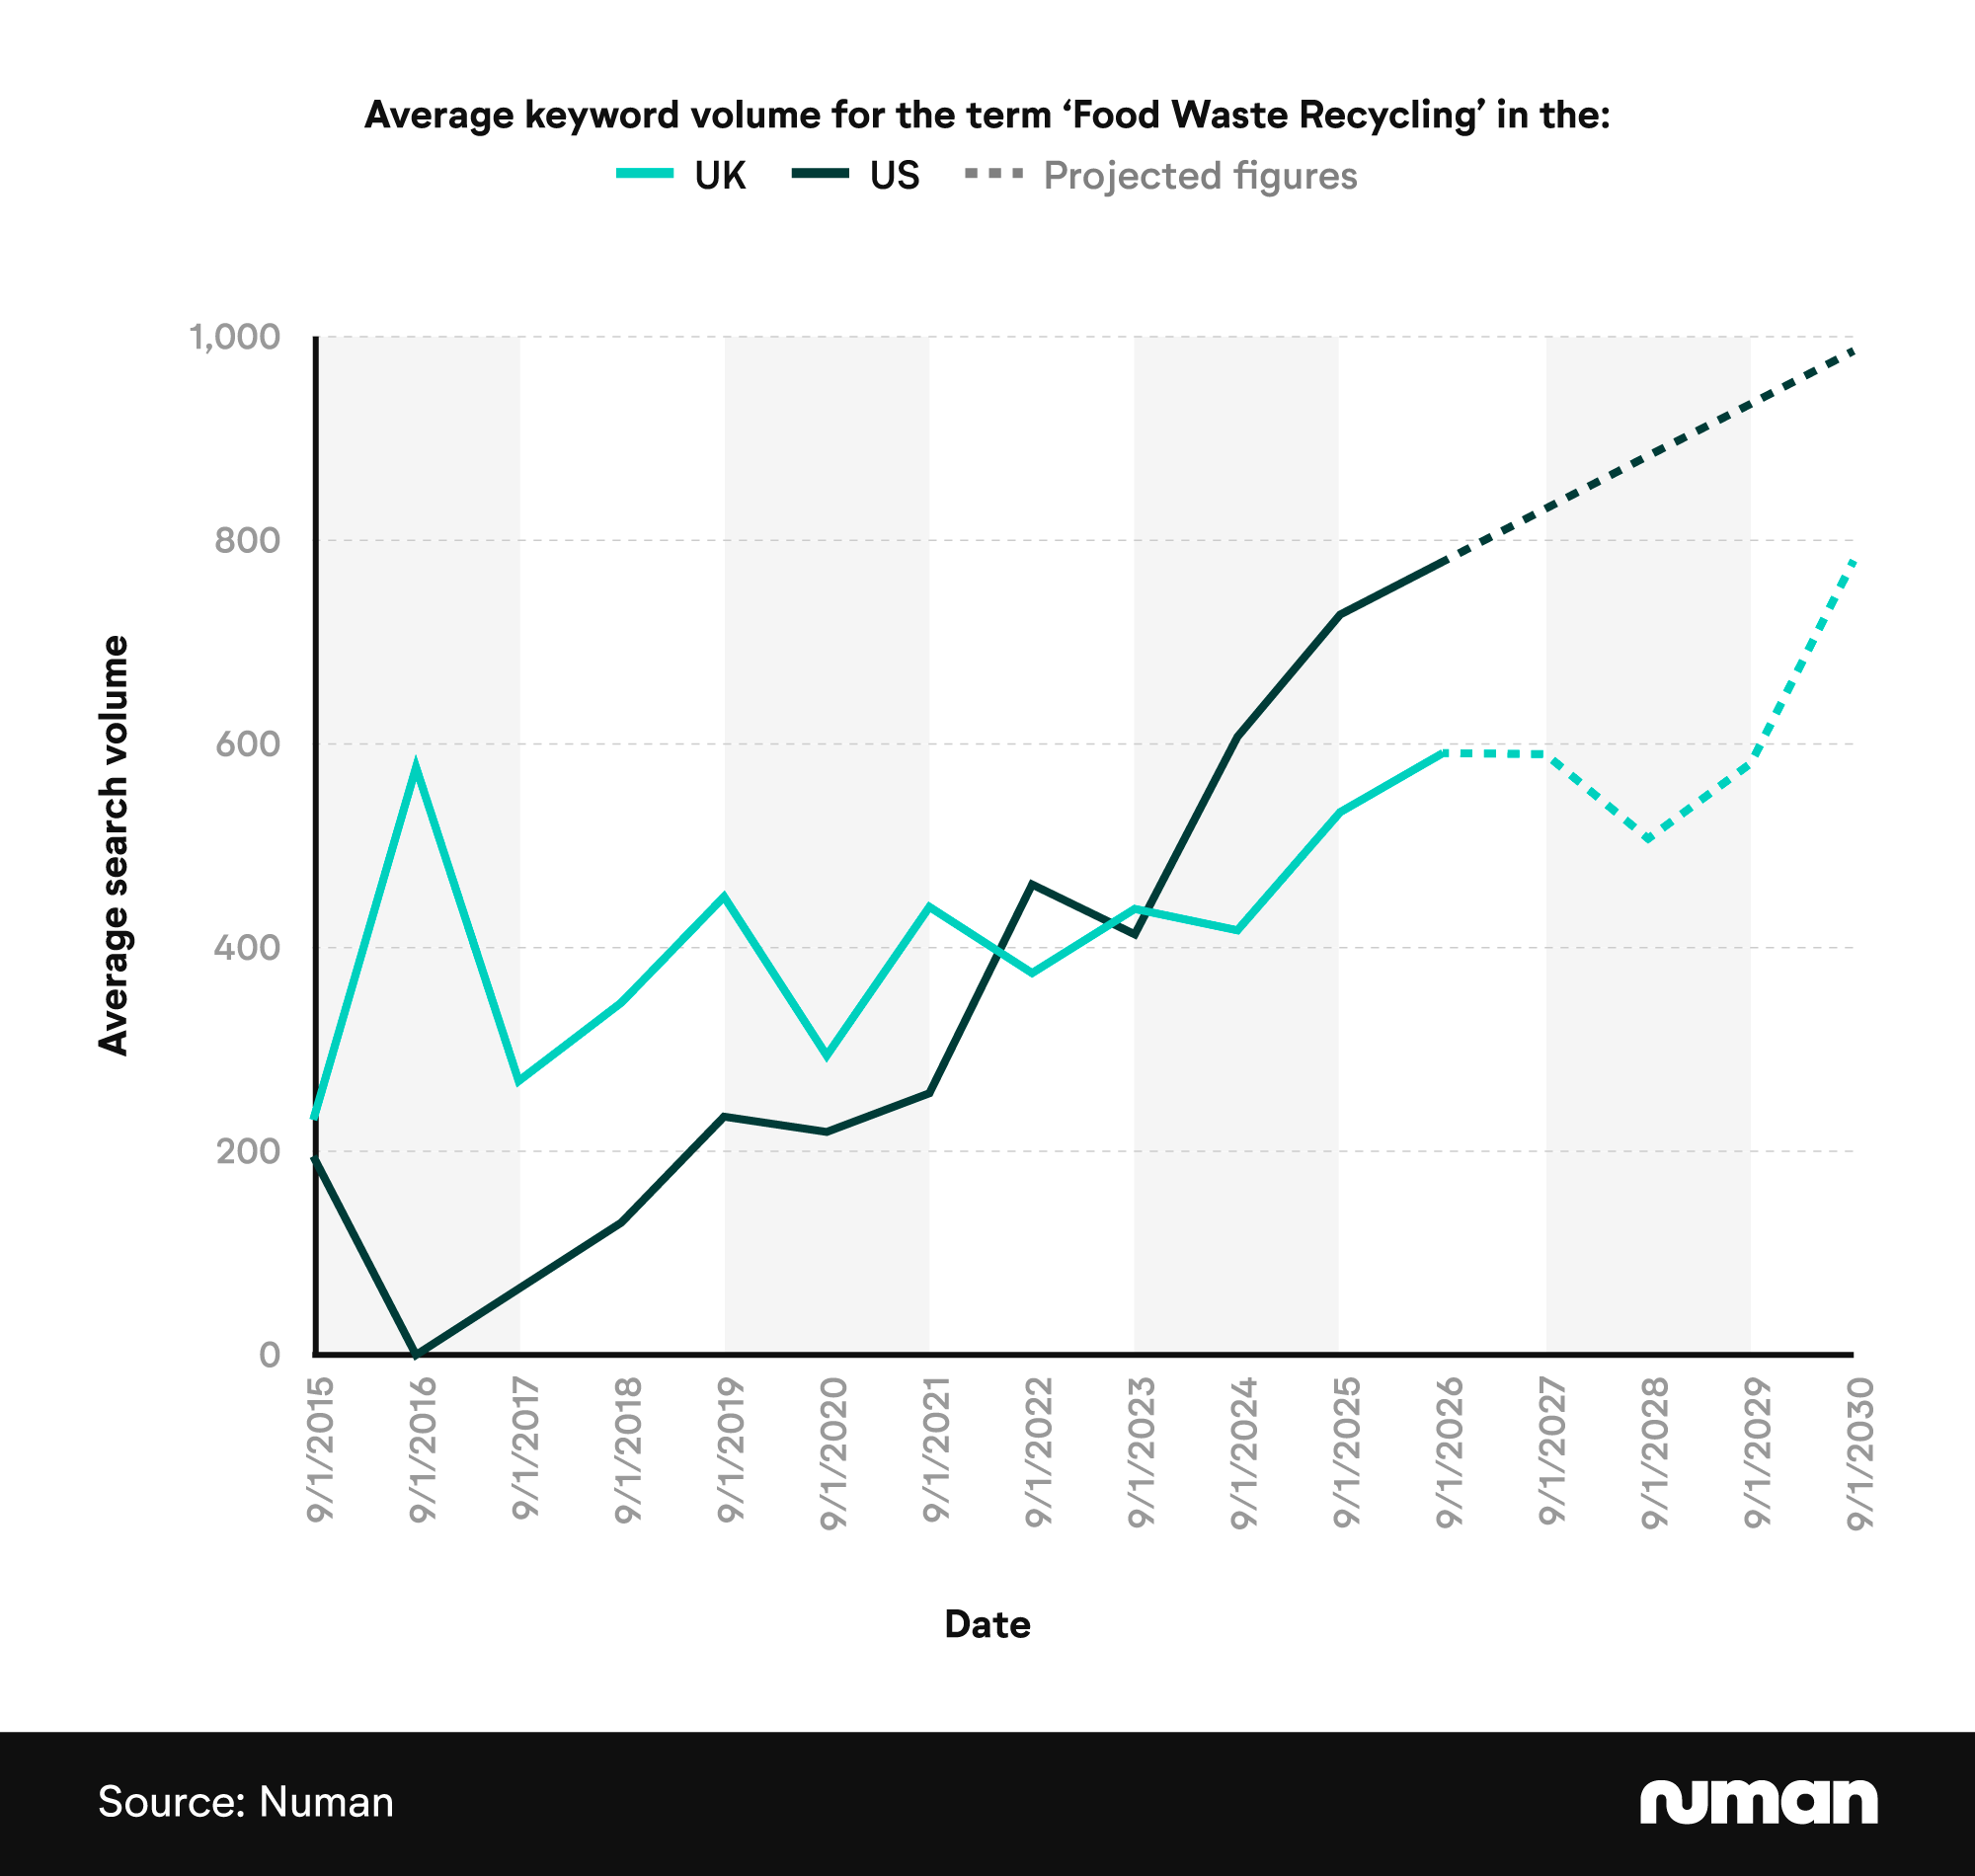
Numbers in the US have fluctuated further, falling from 195 in September 2015 to 0 a year later. From here, the total would steadily climb, reaching 462 in September 2022, before surpassing 700 by 2025.
Search volumes are projected to continue climbing for the rest of the decade, surpassing 800 in 2027 before reaching 986 by 2030. If correct, then search volumes in September 2030 will be around 36% more than in 2025 and over five times greater than in 2015.
Average keyword volume for the term ‘Food Waste Management’ by country, September 2015 to September 2030
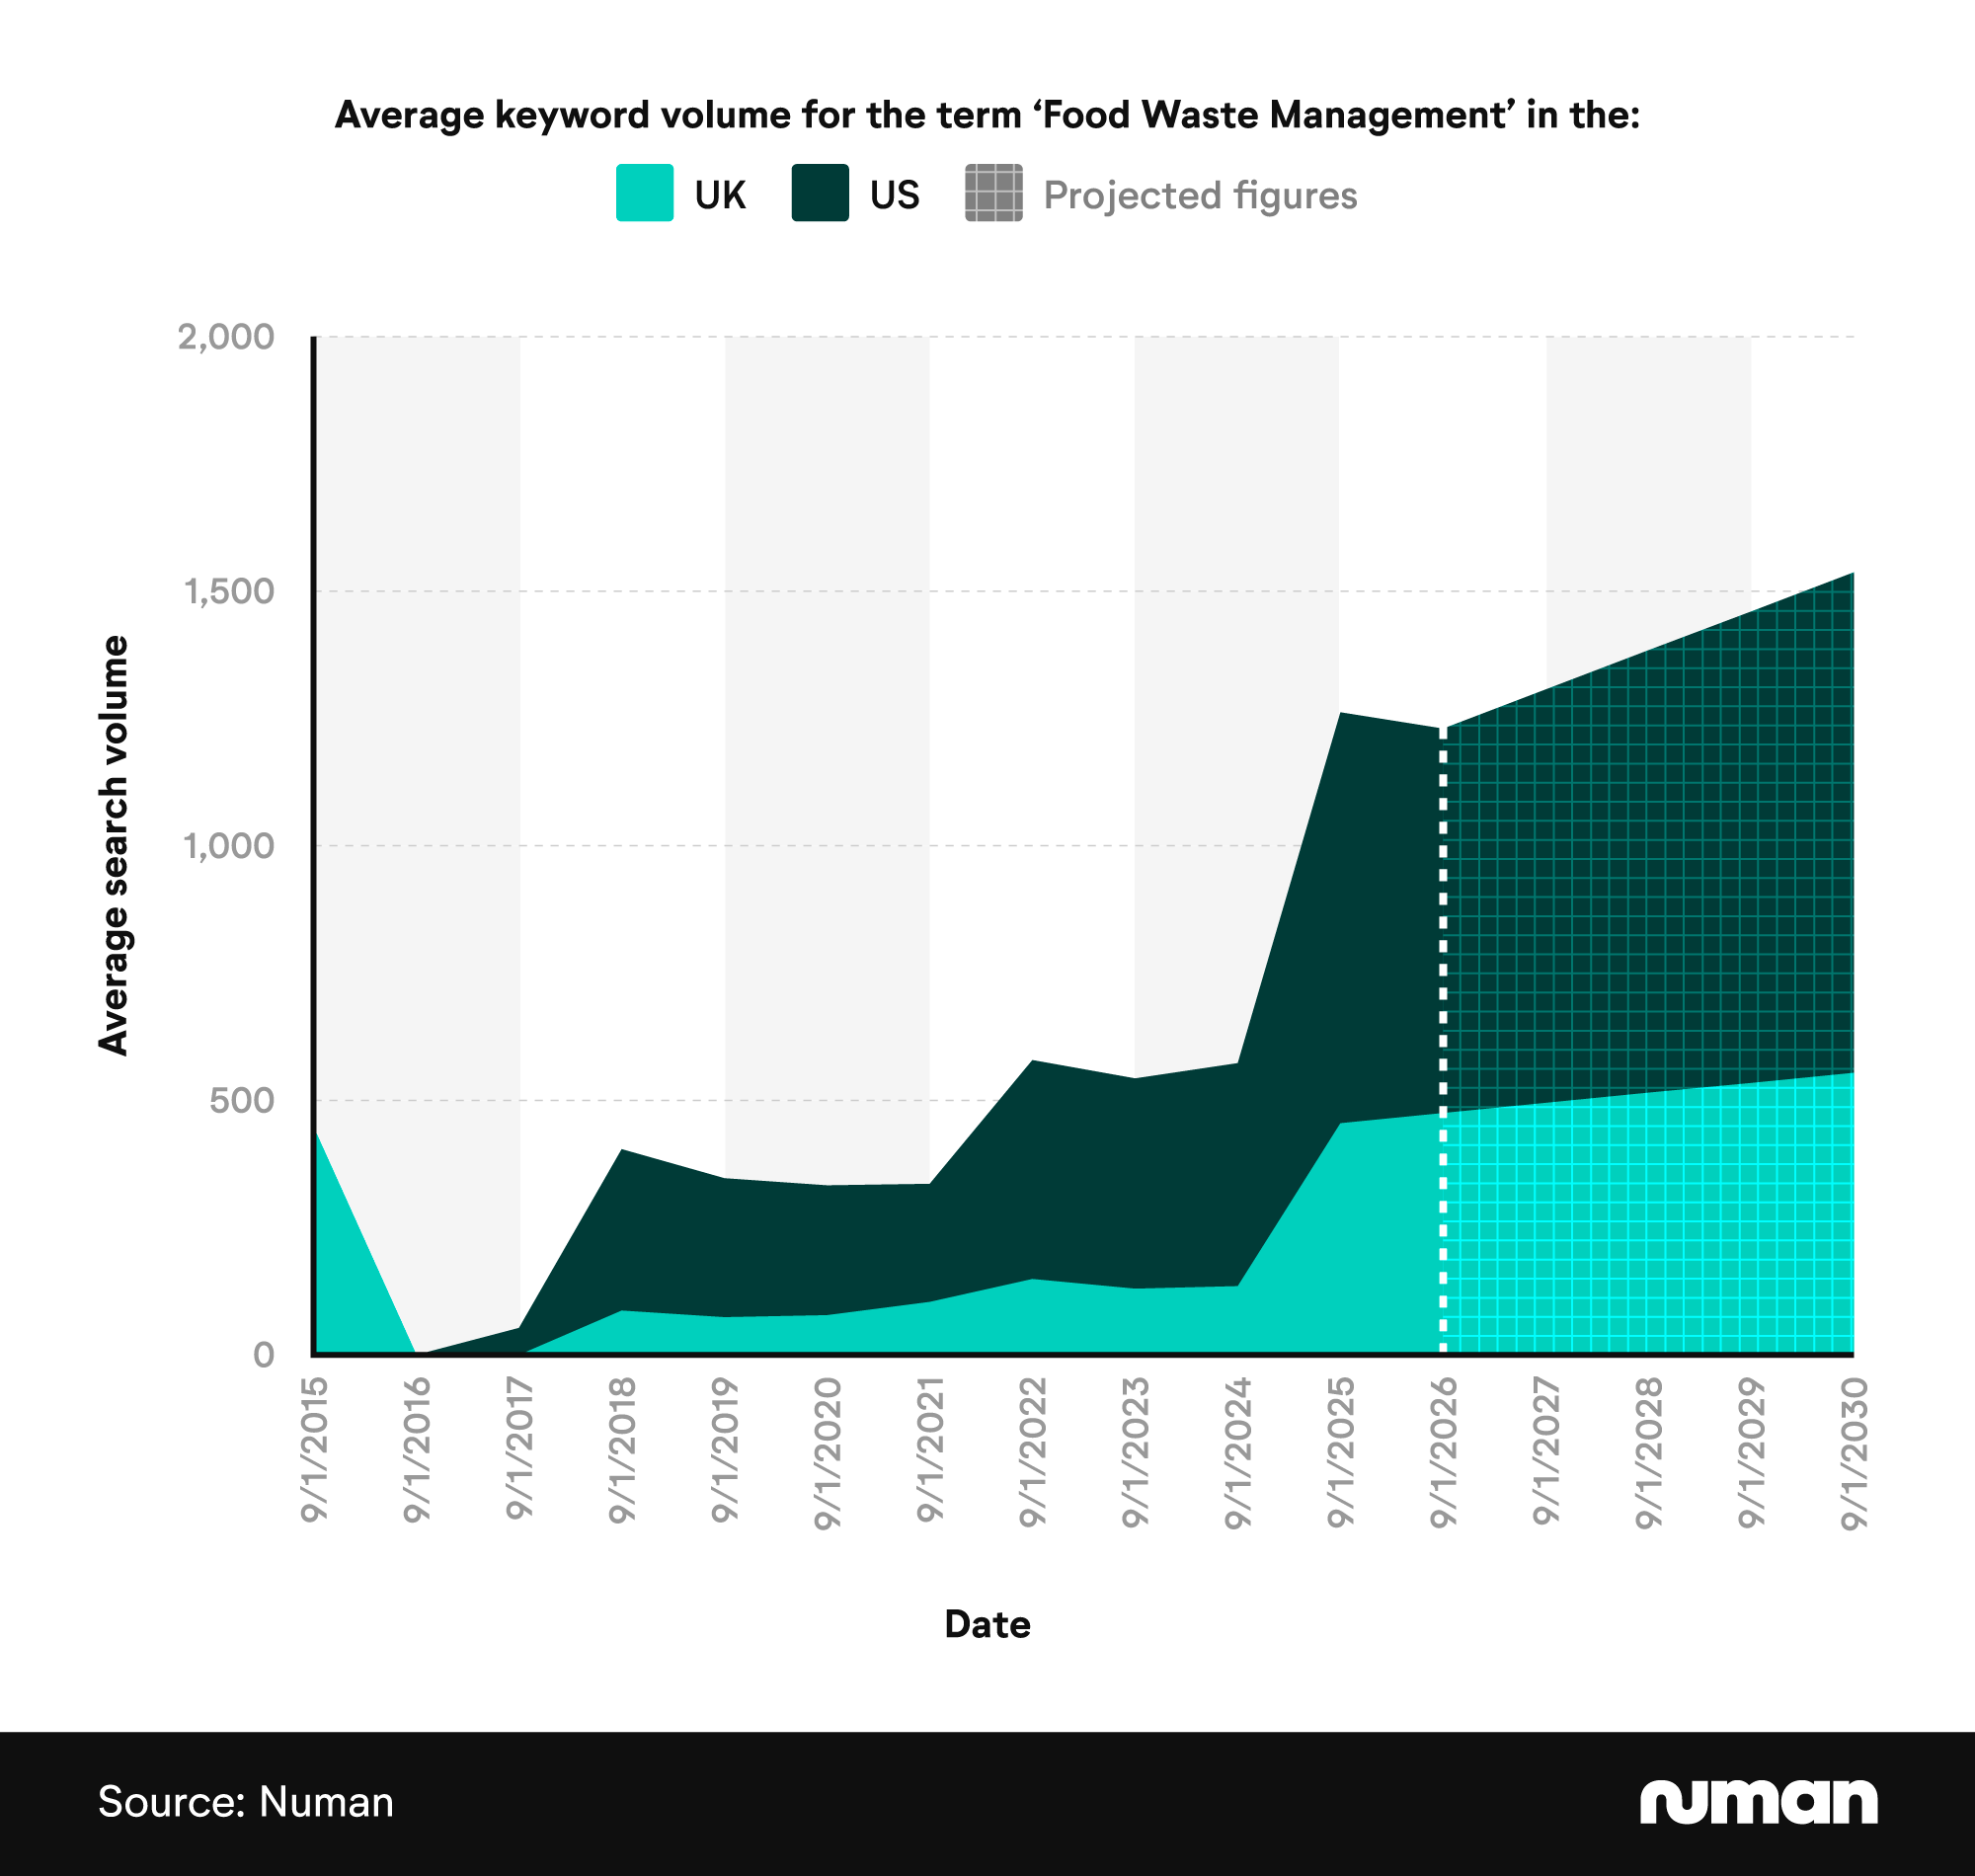
Search volumes for ‘food waste management’ remained modest in the UK between September 2015 and 2024, with a recent spike in 2025 suggesting a significant increase in interest.
After two consecutive Septembers with no search volumes in 2016 and 2017, numbers sat between 70 and 150 over the next seven years before a spike in 2025 took the total to 455. Slower growth is projected for the following five years, taking the total to 554 by 2030.
A similar story occurred in the US, with numbers nearly doubling from 438 in September 2024 to 807 the following year. By 2030, the average monthly search volume is expected to reach 983 – a 22% rise over five years.
Average keyword volume for the term ‘Food Waste Disposal’ by country, September 2015 to September 2030
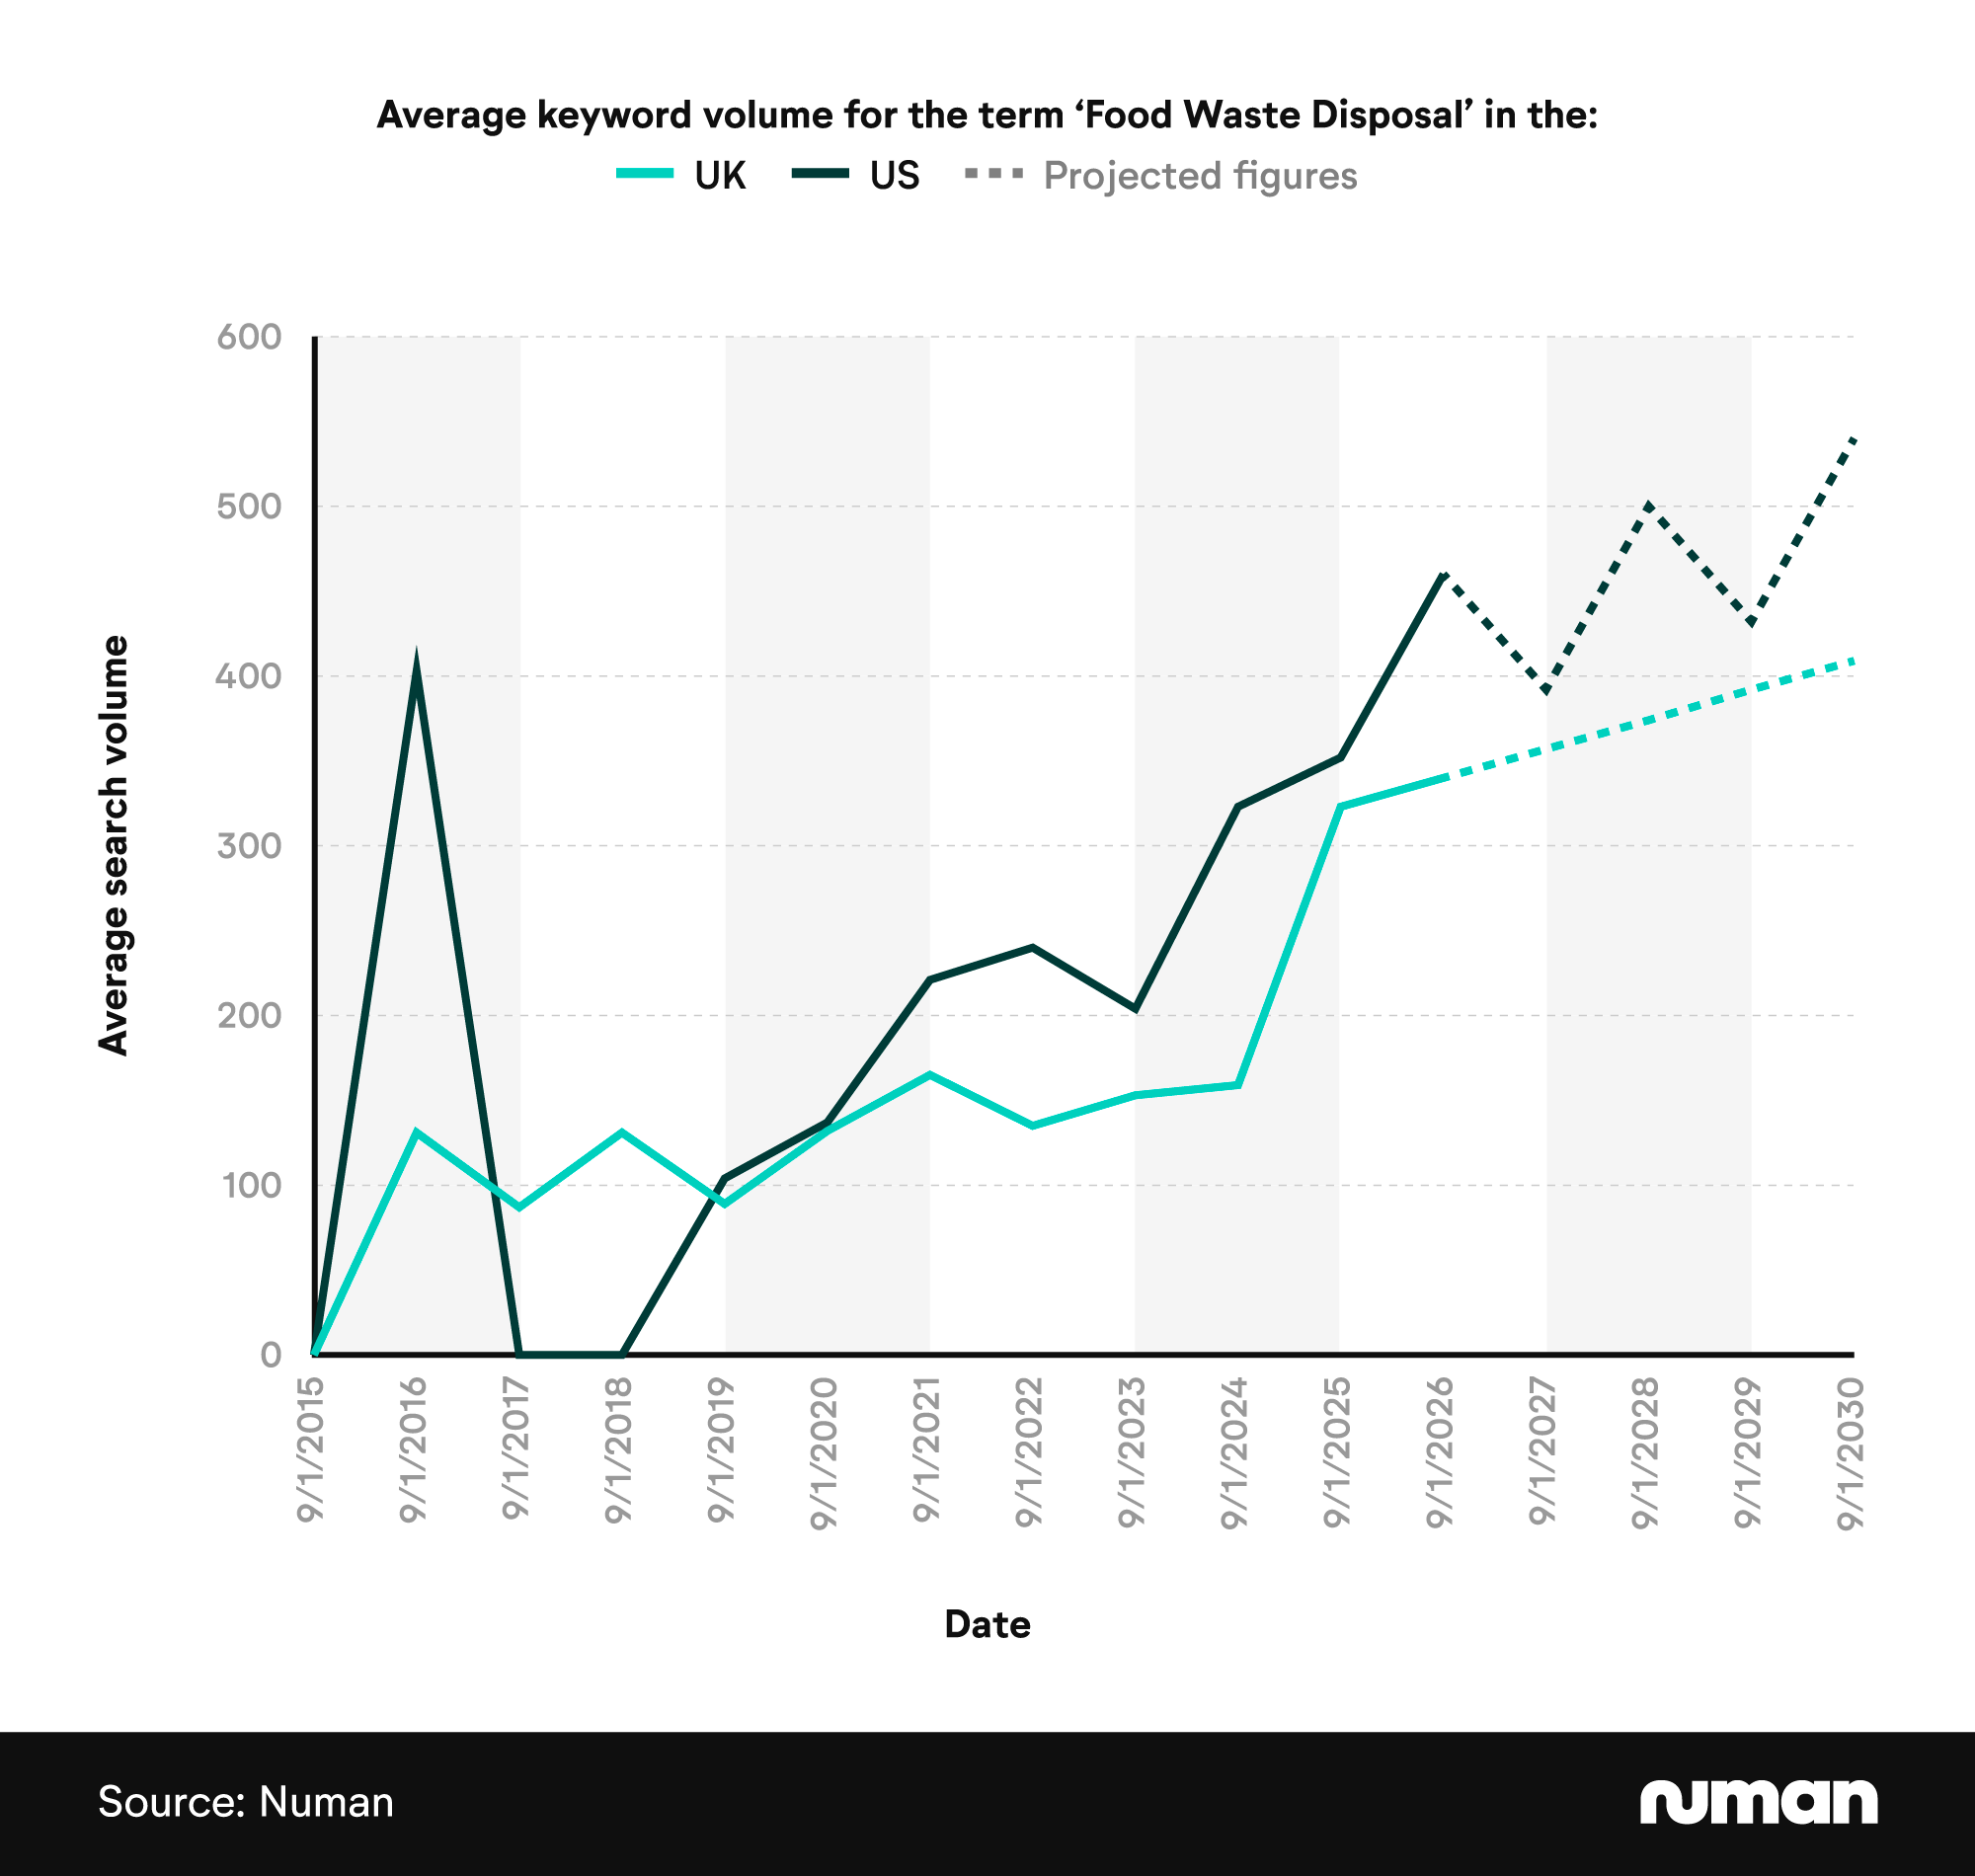
Food waste statistics show that the average UK keyword volume for ‘food waste disposal’ stood at 323 in September 2025 – more than double the total from the previous year (159). Growth looks set to continue in the coming years, with the projected total for September 2030 standing at 409 – nearly 27% more than in 2025.
A similar story occurred in the US, with the latest total of 352 for September 2025, marking a rise of roughly 73% from the same time in 2023. This growth looks set to continue in the second half of the decade, reaching 540 by September 2030.
Average keyword volume for the term ‘Composting Food Waste’ by country, September 2015 to September 2030
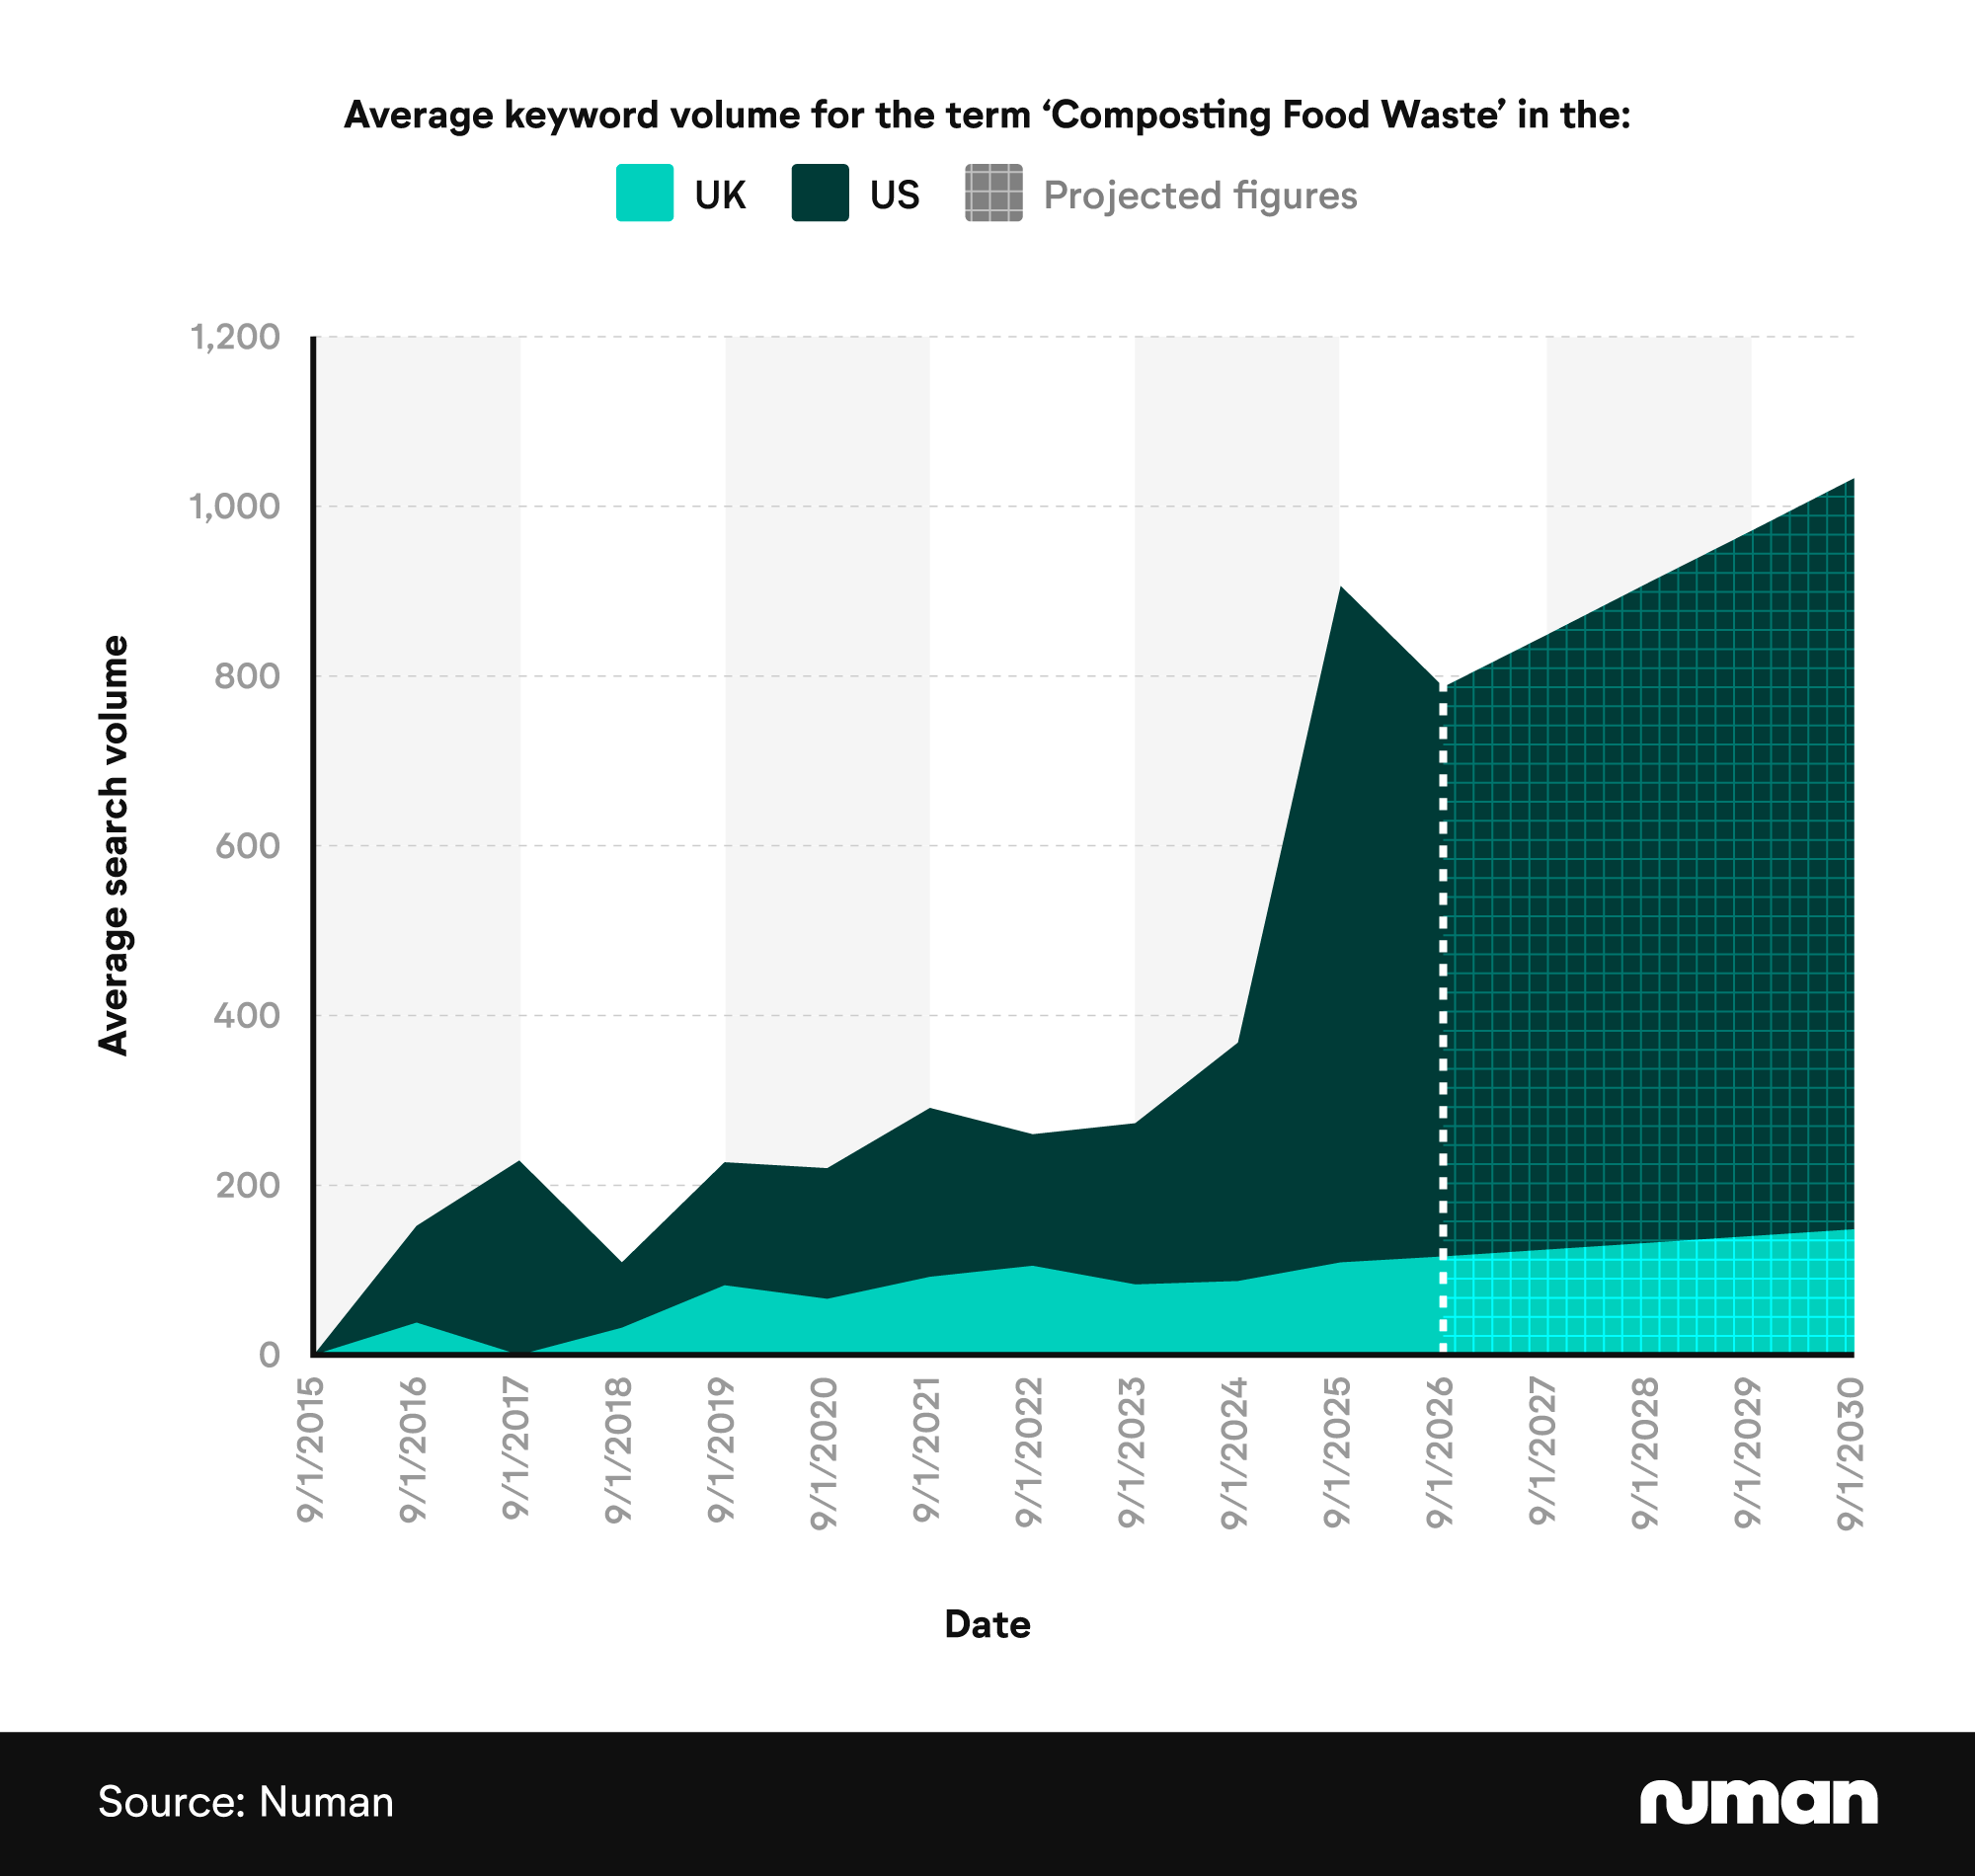
Food Waste composting had the biggest disparity in search volumes between the US and UK of all the keywords we analysed The average search volume in the US stood at 797 in September 2025, more than seven times the UK total of 109.
Both countries are projected to see growth between 2025 and 2030, with the percentage gap reducing slightly. By September 2030, the US average search volume is expected to reach 885, just under six times more than the UK (148).
How to reduce food waste at home
Reducing food waste helps the planet and saves you money. Try these simple, practical steps:
Plan your meals
Plan a few days ahead and shop from a short list so you only buy what you’ll use. That cuts impulse buys and over‑stocking - common causes of wasted food.
Store food properly
Keep perishables in the right place (fridge, freezer or pantry) and use airtight containers where helpful. Proper storage extends shelf life and means less gets thrown away.
Understand labels
“Best before” is about quality, but food may still be fine after this date. “Use by” is about safety - don’t eat foods past this date. Knowing the difference helps you avoid binning perfectly good food.
Use leftovers
Turn extra ingredients into soups, stews, stir‑fries or simple snacks instead of throwing them out. A little creativity stretches meals further and reduces waste.
Start with one change this week and build from there - small habits add up.
FAQs
References
1. The Waste and Resources Action Programme. UK Food Waste & Food Surplus – Key Facts. 2025 July.
2. WRAP. Food waste facts. Businesswaste.co.uk. 2025. [accessed 26 Sept 2025] Available from: https://www.businesswaste.co.uk/food-waste-the-facts/
3. Food waste by country 2025. World Population Review. [accessed 26 Sept 2025] Available from: https://worldpopulationreview.com/country-rankings/food-waste-by-country
4. Cohen D. Revealed: UK’s largest supermarkets throw away enough food for 190 million meals each year. Independent. 2021 Feb 27; [accessed 26 Sept 2025] Available from: https://www.independent.co.uk/news/uk/home-news/supermarket-waste-food-poverty-b1807617.html
5. Goodwin L, Lipinski B. How Much Food Does the World Really Waste? What We Know — and What We Don’t. Wri.org. 2024. [accessed 26 Sept 2025] Available from: https://www.wri.org/insights/how-much-food-does-the-world-waste#:~:text=Around%20one%2Dthird,global%20food%20systems
6. Driven to Waste Global Food Loss on farms. Panda.org. [accessed 26 Sept 2025] Available from: https://wwf.panda.org/discover/our_focus/food_practice/food_loss_and_waste/driven_to_waste_global_food_loss_on_farms/
7. Safdie S. Global food waste in 2025. Greenly.earth. [accessed 26 Sept 2025] Available from: https://greenly.earth/en-gb/blog/industries/global-food-waste-in-2022
8. Food systems and food security. BCG Global. [accessed 26 Sept 2025] Available from: https://www.bcg.com/capabilities/social-impact/food-systems-food-security
9. International-day-awareness-food-loss-and-waste. Food Safety. [accessed 26 Sept 2025] Available from: https://food.ec.europa.eu/food-safety/food-waste/international-day-awareness-food-loss-and-waste_en
10. Food waste. Food Safety. [accessed 26 Sept 2025] Available from: https://food.ec.europa.eu/food-safety/food-waste_en
11. Francis-Devine B, Malik X, Foley N. Food poverty: Households, food banks and free school meals. Parliament.uk. 2025. [accessed 26 Sept 2025] Available from: https://commonslibrary.parliament.uk/research-briefings/cbp-9209/
12. Food waste facts. Business Waste. 2024. [accessed 26 Sept 2025] Available from: https://www.businesswaste.co.uk/food-waste-the-facts/
13. Alfie. Food waste – 2025 facts & statistics. Waste Management Services | Recycling | WasteManaged. Waste Managed; 2024. [accessed 26 Sept 2025] Available from: https://www.wastemanaged.co.uk/our-news/food-waste/food-waste-facts-statistics/
14. Boland H. Tesco to give shoppers free food to meet net zero targets. Telegraph.co.uk. 2025. [accessed 26 Sept 2025] Available from: https://www.telegraph.co.uk/business/2025/03/12/tesco-to-give-shoppers-food-for-free-after-net-zero-row/#:~:text=Tesco%20to%20give,to%20slash%20waste
15.Simpler recycling: workplace recycling in England. Gov.uk. [accessed 26 Sept 2025] Available from: https://www.gov.uk/guidance/simpler-recycling-workplace-recycling-in-england
16. Phillips D. New Waste Legislation 2025: Is Your Business Ready? Banneruk.com. 2024. [accessed 26 Sept 2025] Available from: https://www.banneruk.com/new-waste-legislation-2025-is-your-business-ready/#:~:text=Coming%20into%20effect,biogas%20and%20fertilisers
17. Fast food’s contribution to food waste. Shapiro. Skip Shapiro Enterprises; 2024. [accessed 26 Sept 2025] Available from: https://shapiroe.com/blog/junk-food-waste/
18. Delucci R. 24 eye-opening restaurant food waste statistics in 2025. The Restaurant HQ. 2025. [accessed 26 Sept 2025] Available from: https://www.therestauranthq.com/trends/restaurant-food-waste-statistics/
19. Malik X, Smith L, Stewart I, Burnett N. Food waste in the UK. 2024 Dec.
20. Jalla V. A beginner’s guide to food waste recycling in the UK. Keenan Recycling. 2023. [accessed 26 Sept 2025] Available from: https://keenanrecycling.co.uk/a-beginners-guide-to-food-waste-recycling-in-the-uk/
21. Mali S, Cognitive Market Research. Food Waste Management market will grow at a CAGR of 5.80% from 2024 to 2031. Cognitive Market Research. 2023. [accessed 26 Sept 2025] Available from: https://www.cognitivemarketresearch.com/food-waste-management-market-report
22. Kabeyi MJB, Olanrewaju OA. Biogas production and applications in the sustainable energy transition. J Energy. 2022;2022:1–43.
23. Todd ECD, Faour-Klingbeil D. Impact of food waste on society, specifically at retail and foodservice levels in developed and developing countries. Foods. 2024;13(13):2098.
